INS
TALLER MANU
AL
6
2.3
Display (operation)
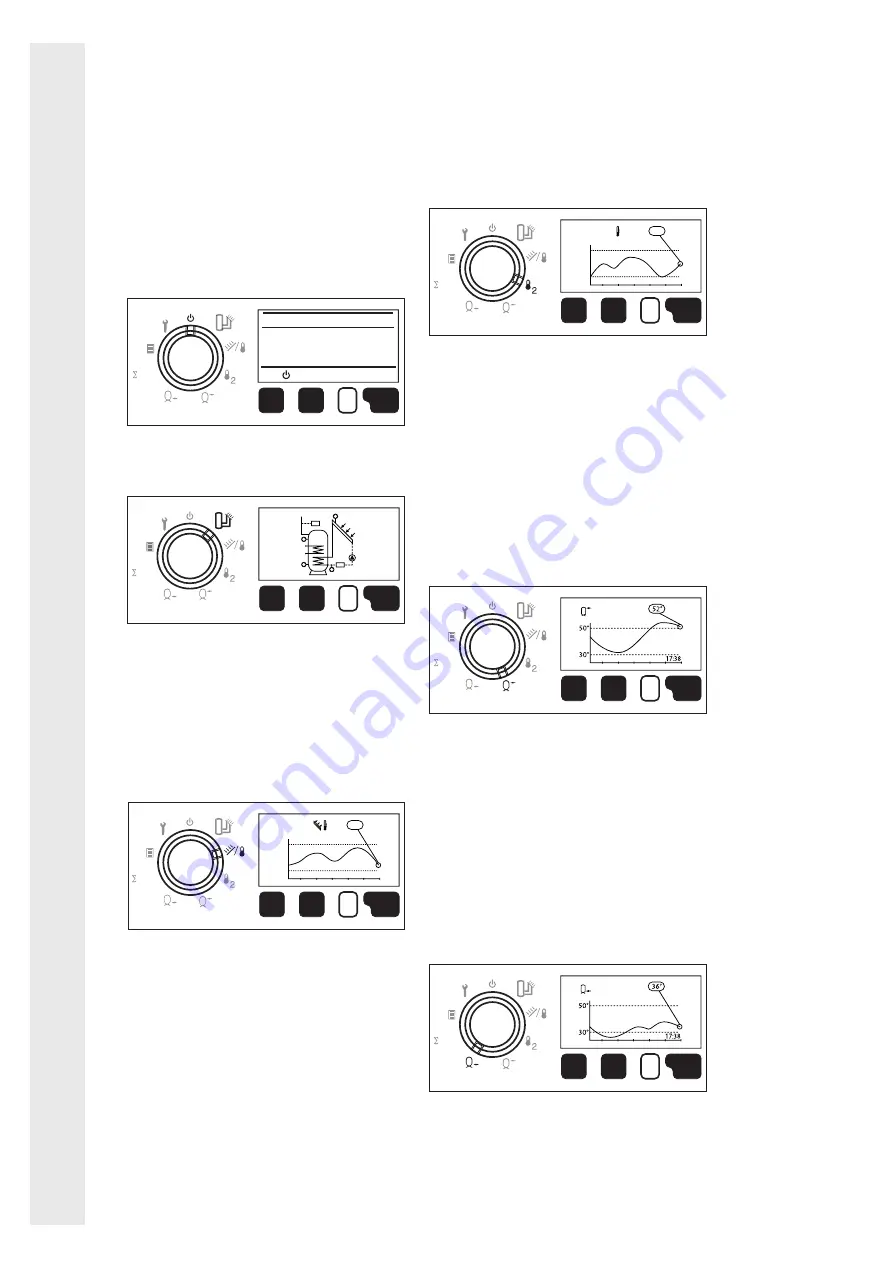
Display content
-
The content of the display depends on the
position of the function selector.
-
If a system configuration error is detected,
the display turns red.
Standby
-
The controller is electrically live.
Automatic mode
-
The display shows a schematic of the cur-
rently selected system, together with its
actuators and sensors.
-
Turn the selector knob to view either the
names of the various actuators and sensors
(e.g. F1, F2, A1) or their current statuses
and temperatures.
Temperature of sensor F1 (collector/boiler)
-
The display reads out the temperature of
the solar collector currently measured by
sensor F1. In some system configurations,
the temperature measured by the solid fuel
boiler temperature sensor is shown instead.
-
The sensor’s temperature curve for the last
few hours is also shown.
-
The display is updated every minute. The
current time is shown at the bottom right of
the graph.
OFF
Turn to switch the controller on
The controller is powered
on but in standby mode
esc
kWh
esc
kWh
F1
F2
A1
F3
F4
esc
kWh
17:38
80°
70°
72°
Temperature of sensor F2 (supplementary
temperature sensor)
-
The display reads out the temperature cur-
rently measured by temperature sensor F2.
-
The sensor’s temperature curve for the last
few hours is also shown.
-
The display is updated every minute. The
current time is shown at the bottom right of
the graph.
-
If temperature sensor F2 is not installed, the
display reads out the message “Not con-
nected”.
Temperature of sensor F3 (top of storage
cylinder)
-
The display reads out the temperature cur-
rently measured by temperature sensor F3.
-
The sensor’s temperature curve for the last
few hours is also shown.
-
The display is updated every minute. The
current time is shown at the bottom right of
the graph.
-
If temperature sensor F3 is not installed, the
display reads out the message “Not con-
nected”.
Temperature of sensor F4 (bottom of stor-
age cylinder)
-
The display reads out the temperature cur-
rently measured by temperature sensor F4.
-
The sensor’s temperature curve for the last
few hours is also shown.
-
The display is updated every minute. The
current time is shown at the bottom right of
the graph.
esc
kWh
17:38
55°
45°
50°
2
esc
kWh
Top
esc
kWh
Bottom


