12.5. Autoscaling of graphs in PDF
The graph of the report is created dynamically depending on the following settings:
• the alarm limits of the device
• the highest and lowest measured value
This is valid for all graphs in the PDF file until:
• the highest and lowest measured values drop out of the history
• the temperature settings are changed (self-configurable device only)
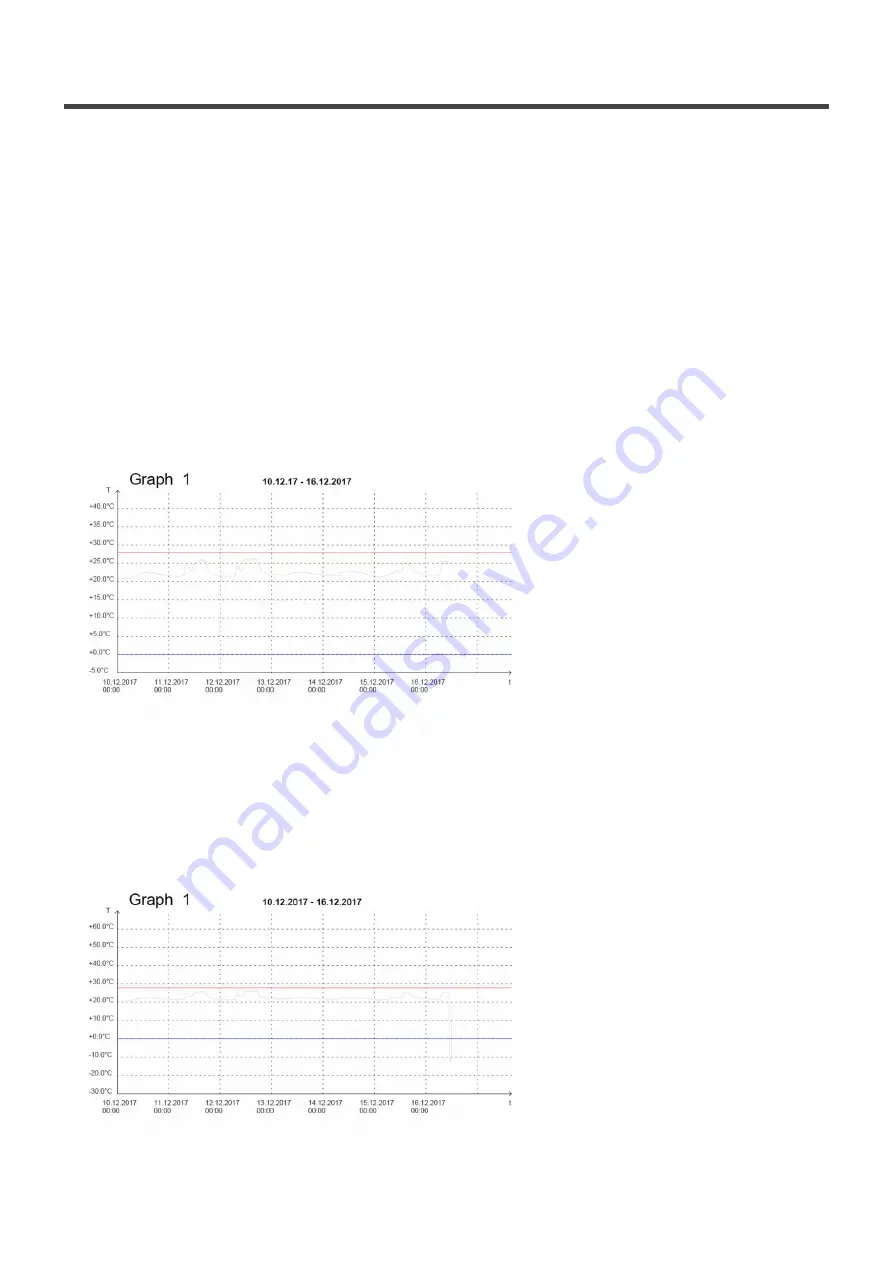
Example below: The scale of the graph depends on the alarm limits set. The temperature scale ranges
from +40°C to –5°C for the limits of +0.5°C and +28°C.
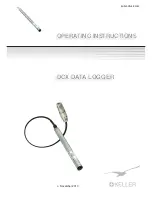
Example below: The scale of the graph depends on the highest and lowest measured temperature
values. The temperature scale ranges from –30°C to +60°C. Lowest measured temperature: –12°C,
highest measured temperature: +25°C.
Berlinger & Co. AG
User Manual Fridge-tag Ultra Low - 1
Page 49 of 57


