8
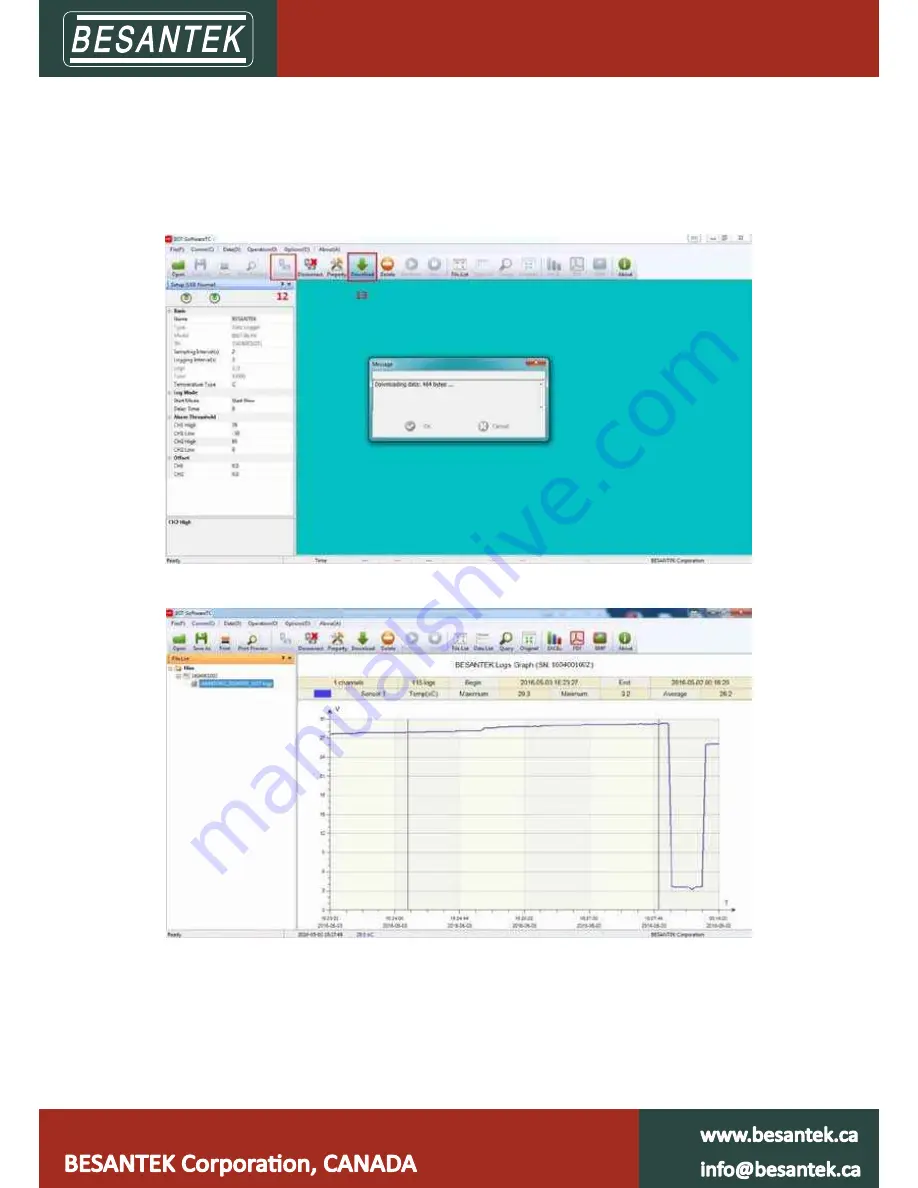
2.5 Download the Records after a Measurement.
10. Connect the data logger to a free USB port on the computer.
11. Running BSTSoftware on the PC.
12. From the toolbar select Connect.
13. From the toolbar select Download
Once the data is transferred from the logger to the PC, the data graph will be displayed.
The graph display will be blank if there are not any logs.
Tips: Press and hold the left mouse button to drag a box, when the left mouse button is
released, the graph will be redraw with the data in the selected rectangle area. Click
right button, then the graph will be redrawing with all the data in the logs file.


