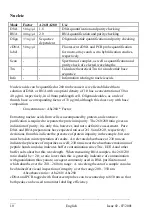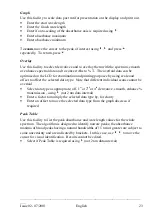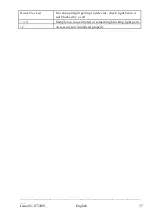
________________________________________________________________
___
22
English
Issue 02 - 07/2001
Wavescan
A graph of change of absorbance against wavelength is known as an absorption
spectrum and is one of the most useful physical characteristics of a compound, both
as means of identification (qualitative analysis) and of estimation (quantitative
analysis). It arises because of the various electronic transitions that are possible
within a molecule, and the peaks are broad (in solution). A derivative of a spectrum
can provide additional information; the 1
st
order derivative enables identification of
multiple peaks that are close together, 2
nd
order enables identification of peak
shoulders (inflections) and 4
th
order identifies both multiple peaks and inflections at
the same time. The procedure is as follows:
Set up
•
Enter start wavelength (range 190-1090nm)
•
Enter end wavelength (range 200-1100nm)
•
Select scan speed as appropriate; slow , medium or fast, using
4
•
Select data interval, 2.0, 1.0, 0.5, 0.2 or 0.1 nm, using
4
•
Nominal scan speeds are shown in the table below
•
Select if a reference scan is required using
4
; if yes, the reference scan will act
as a temporary baseline
•
Save method if required using
4
•
Insert reference and samples, and press
run
Data interval, nm
2.0
1.0
0.5
0.2
0.1
Fast, nm/min
7300
4600
2600
1100
600
Medium, nm/min
4600
2600
1400
600
300
Slow, nm/min
3300
1800
1000
400
200
•
A smaller data interval gives improved peak resolution
•
The minimum and maximum wavelength scanning ranges for 0.2 and 0.1 nm data
intervals are 10 – 500 nm and 10 – 250 nm, respectively; full scanning range at
these data intervals requires the use of SWIFT II software.


