17
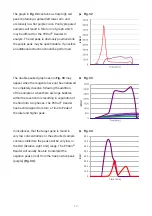
The graph in
Fig. 32
contains a sharp high red
peak containing a spread left lower arm and
a relatively low flat purple curve. Poorly prepared
samples will result in this form of graph which
may be difficult for the PCRun Reader to
analyze. The red peak is obviously positive while
the purple peak may be questionable. If possible
an additional extraction should be performed.
The double peaked graph seen in
Fig. 33
may
appear when the reagents have not been allowed
to completely dissolve following the addition
of the sample or when there are large bubbles
within the reaction mix resulting in separation of
the fluid into two phases. The PCRun Reader
has been designed to return a Time to Peak of
the later and higher peak.
Fig. 32
Fig. 33
®
kRL
U
®
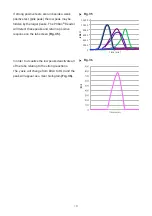
In incidences that the target gene is found in
very low concentrations or the extracted sample
contains inhibitors the peaks will be very low, in
the RLU (Relative Light Unit) range. The PCRun
Reader will usually be able to interpret the
negative peaks (red) from the true positive peak
(purple)
(Fig. 34).
Fig. 34
100
0
200
300
400
500
600
700
800
Time(min)
R
LU
®


