CAUTION
Do not 22 dBm (100
mW) RF Power input at the measurement port.
Damage to the units RF module will result.
Bird SiteHawk Operation Manual
17
Note:
Antenna systems can build up a static charge large enough to
damage the SiteHawk, if discharged through the device. It is
recommended a load or attenuator be used to bleed off any static
charge prior to connecting the SiteHawk to the system.
Note:
Changing frequency settings will automatically turn calibration
off. Always set the frequency before calibrating the unit.
6.
Connect the SiteHawk to the device under test.
7.
Wait 10 Seconds for the sweep to update.
Interpreting the Measurement
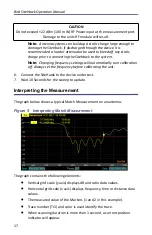
The graph below shows a typical Match Measurement on an antenna.
Figure
9
Interpreting Match Measurement
The graph contains the following elements:
Vertical grid scale (y axis) displays dB and ratio data values.
Horizontal grid scale (x axis) displays frequency, time or distance data
values.
The measured value of the Markers (1 and 2 in this example).
Trace number (Tr1) and color is used identify the trace.
When scanning duration is more than 1 second, a current position
indicator will appear.


