47
1.877.877.2269
BLACKBOX.COM
NEED HELP?
LEAVE THE TECH TO US
LIVE 24/7
TECHNICAL
SUPPORT
1.877.877.2269
CHAPTER 4: WEB GRAPHICAL USER INTERFACE (GUI)
Reading Offset: The Reading Offset feature is a calibration tool. If you wish to calibrate the temperature sensor, for
example, you could enter an offset value of 5. This would mean if the sensor reads 20 degrees then it would record
as 25 degrees. This figure can also be a minus figure (e.g. -5 would show 15 degrees instead of 20).
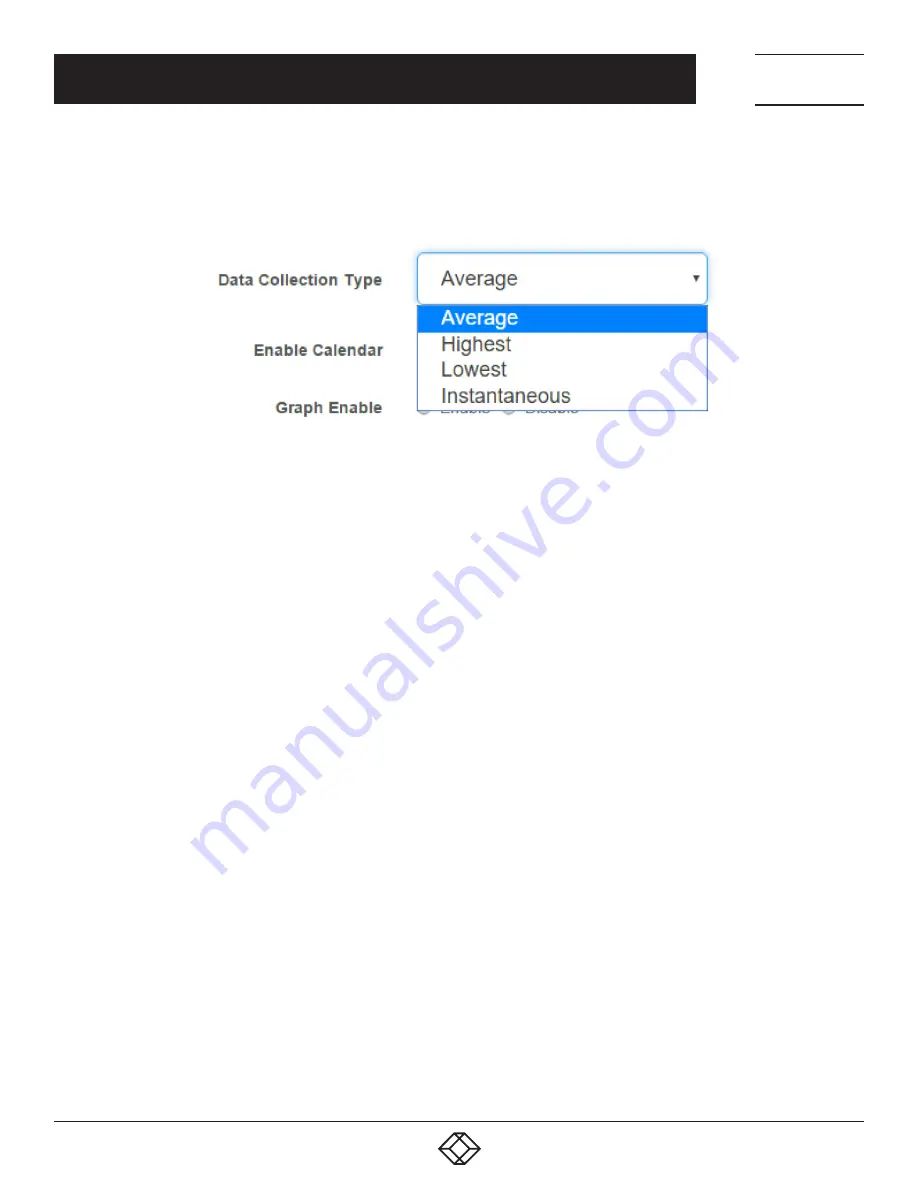
FIGURE 4-59. DATA COLLECTION TYPE DROP-DOWN MENU
Data Collection Type: This refers to the data collection from the sensor and how the data is then displayed on the
graphs.
There are four options for the collection of data: Average, Highest, Lowest and Instantaneous. The default setting is
Average.
When the data collection type is set to Average, the averaged value between 2 graph intervals is stored and output
graphs for the daily, monthly, and yearly all have the same size on the screen. For the daily graph, each data point
on the graph is one data point collected from the sensor. But for the monthly and yearly graph, to display more data
into the same size as the daily graph, some consolidation on the data is needed. One data point on the monthly and
yearly graph is an average of the sensor data in a range.
The maximum and minimum values showing on the monthly and yearly graphs are the value of this consolidated
data and not the raw data over that period of that time.
When the Data Collection Type is set to the Highest setting, then you will get the graphing output displaying the
sensors highest average readings during sampling. This is the same for the Lowest setting (lowest average).
With the Instantaneous setting, you can store the actual value of the sensor at the sampling interval without
averaging.
Graph Enable: To save the data from the sensors on the unit, you will need to enable the Graphing feature on the
unit. You need to change the Enable Graph to the On position and click on the Save button to enable the graphing.
NOTE: You can also enable the graphing from the Summary page.
Filter Status: The Sensor Filter Status is a feature that you can Enable or Disable and when enabled will check the
sensor status. If the status of the sensor changes very rapidly, then it will report how many times the sensor status
changed, instead of having multiple separate entries in the syslog.
When enabled, this will report the changes and status of a sensor only once.


