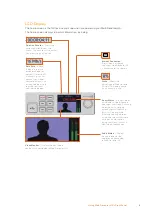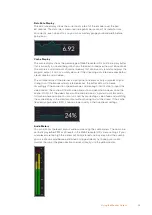
Data Rate Display
The data rate display shows the current data rate of of the encoder over the past
60 seconds. The data rate is measured in megabits per second. This indicator runs
consistently, even when off air, so you can accurately gauge your bandwidth before
going on air.
Cache Display
The cache display shows the percentage of Web Presenter HD’s built in memory buffer
that is currently in use and the graph shows the amount used over the past 60 seconds.
The cache is a small amount of internal memory that continuously records and plays the
program output. It acts as a safety measure if the streaming data rate decreases below
a level able to sustain video.
The variable nature of the internet is mostly due to network activity or wireless signal
strength, so if the broadcast data rate decreases, the buffer data will increase
accordingly. If the connection speed becomes slow enough that it cannot support the
video stream, the cache will fill with video frames to compensate. However, once the
cache is 100% full, the video stream will be compromised, so you will want to avoid a
full cache where possible. You can run a test by connecting a video feed and watching
the cache display in the monitor output without having to start the stream. If the cache
frequently approaches 100%, choose a lower quality in the live stream settings.
Audio Meters
You can monitor the levels of your audio source using the audio meters. These can be
set to display either PPM or VU levels in the Web Presenter HD’s menu settings. If your
audio levels are too high the meters will illuminate red and may mean that the audio in
your live stream could become distorted or clipped. Ideally try to keep your audio
towards the top of the green section and occasionally in to the yellow section.
13
Using the Monitor Output


