Logs (continued)
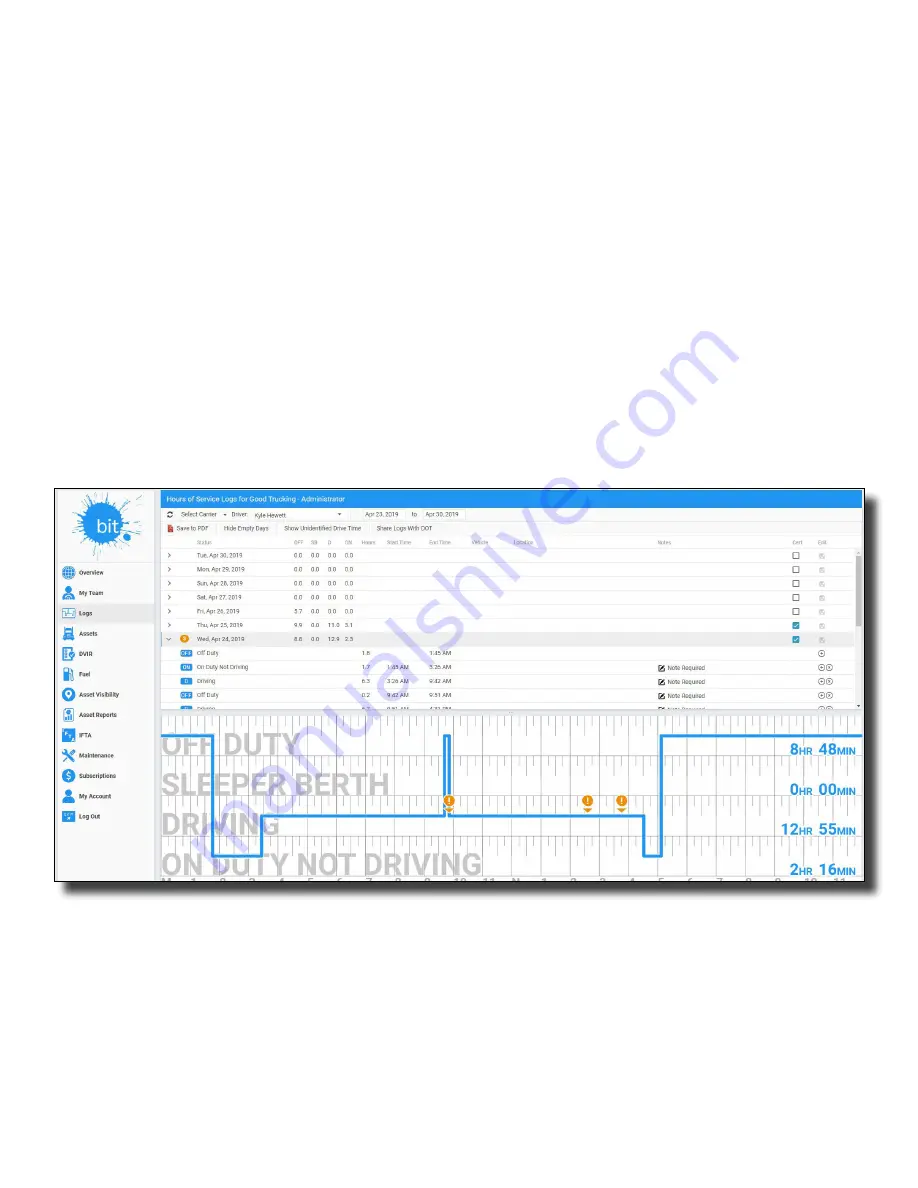
The unexpanded view of the table shows any
potential violations in orange, the total hours
logged in each type of duty status, and whether
the driver has certified the log.
In the example below you can see that there
are three potential violations, and the driver
has only certified two of the logs displayed.
To see the details of a log, click on the
expansion arrow in the far left column. The
expanded view will show each duty status
event with total hours, start and end time, the
vehicle used, location, and any notes entered
by the driver.
The selected log's events will also show on the
graph at the bottom of the page. Placing your
mouse over a duty status on the graph will
highlight the corresponding row in the table.
An orange circle with an “!” is used to depict
potential violations on the graph.
Details will be shown in a popup when your
mouse is placed over the circle. In the example
below, you can see that the second “!”
represents the driver going over their
maximum daily driving hours.
31


