34
Press
to select Ellipse Method. At this time an ellipse area appears which is called
the examined area. Use direction keys to move this area. The right button is applied to shift
among three functions of the mouse to adjust the size and angle;
1. Use the mouse to move the examined area to image display area;
2. Press the right button,and then move the mouse to alter the size of the examined area.
Move the mouse left and right to decrease or increase the area vertically, and then move the
mouse up and down to decrease or increase the area horizontally;
3. Press the right button again,then move the mouse left and right to revolve the examined
area anticlockwise and revolve clockwise;
4. Press the right button again , the function of the mouse will be shifted into Move the
Examined Area;
5. After the location, size, angle of the examined area are confirmed, the measuring can be
done .
If measuring should be continued, press
and
or directly press
,and
repeat Step 1-5. You can get 2 groups of data at most. The results are on the right side of the
screen.
After measuring, press the middle button to clean the screen.
Volume measuring is in the later chapter.
2.7.8 Statistics of Histogram
●Press
in freeze mode, the menu is displayed on the screen.
● Press to
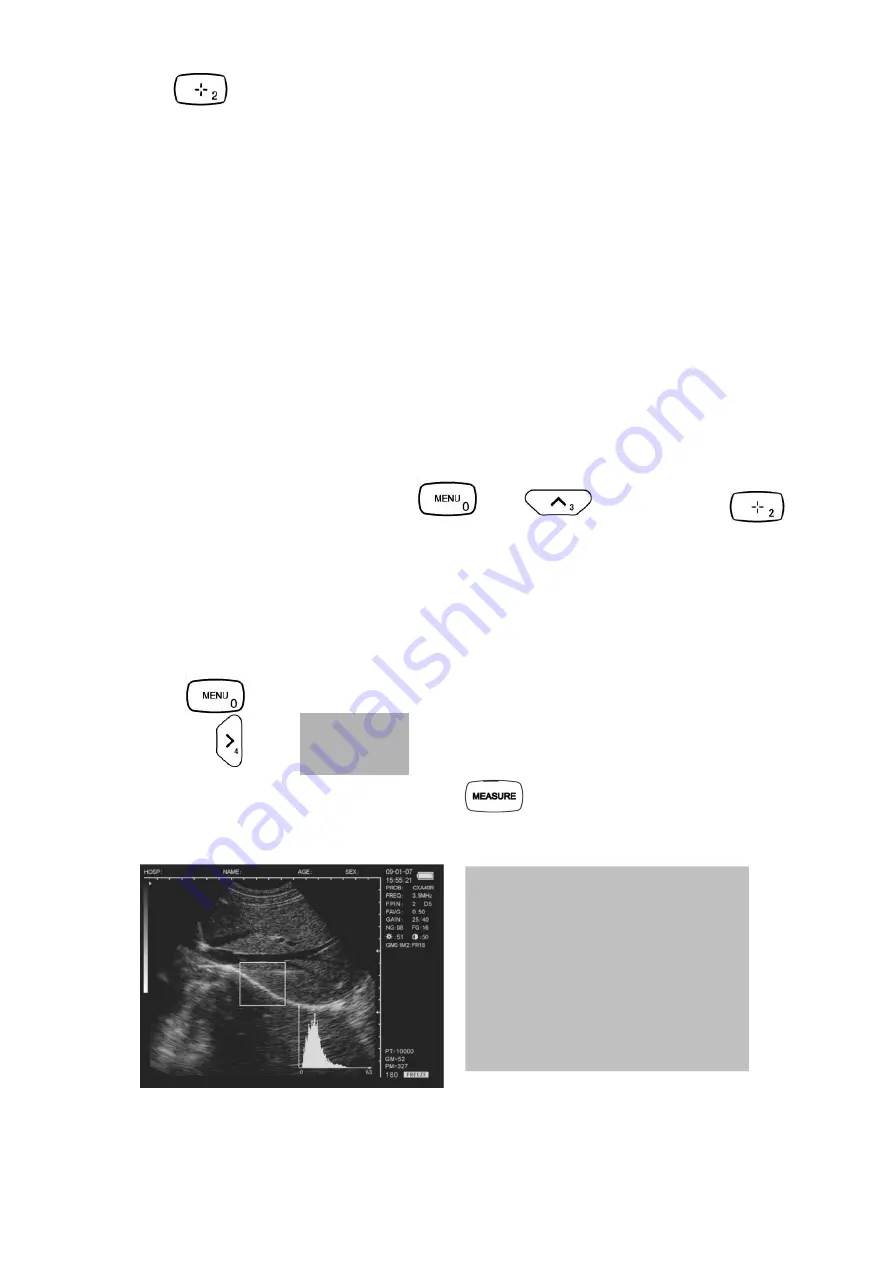
select 4.HISTOGRAM,sampling window is displayed. Use direction keys or
mouse to move to certain area, and press
or the right button to complete the
counting, with the result on the right side of the screen, as follow:
. Illustration of the histogram statistics
X axis stands for grey scale, and y axis
stands for number.
PT stands for the total number of pixels in
the rectangular window.
Gm stands for the grey scale of the curve
at the peak of the y axis.
Pm stands for the number of pixels in Gm
grey scale.
From the above figure, in the rectangular
area, the total number of pixel dots is 10000. At
dray scale 52, there are 327 dots, the most
image pixel dots.


