Commissioning
6 720 808 928 (2017/06)
34
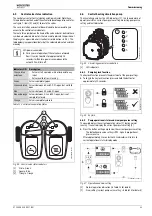
Operational status indication
When the circulation pump is running, LED1 is green. The four yellow
LEDs indicate the current power consumption (P1) as shown in
table 13. When the operation mode is active, all active LEDs are
constantly on in order to differentiate this mode. If the circulation pump
is stopped by an external signal, LED 1 flashes green.
6.6.3
Available hydraulic pressure
The residual hydraulic head available from the heat interface unit is
shown in figure 48 for all proportional pressure settings.
Fig. 48 Available hydraulic pressure
[1]
PP1: lowest proportional pressure curve.
[2]
PP2: intermediate proportional pressure curve.
[3]
PP3: highest proportional pressure curve.
The default setting is PP3: highest proportional pressure curve.
6.6.4
Central heating circulation pump Characteristics
Modulating speed characteristics
Fig. 49 Modulating speed characteristics
[P]
Head (kPA)
[H]
Head (m)
[Q]
Flowrate, (m3/h or l/s)
[P1] Power (W)
• PP1: lowest proportional pressure curve.
• PP2: intermediate proportional pressure curve.
• PP3: highest proportional pressure curve. (default setting)
The head (pressure) is reduced at falling heat demand and increased at
rising heat demand.
Display
Indication
Performance in % of
P1 maximum
One green LED
(flashing)
Standby (only external
controlled)
0
One green LED +
one yellow LED
Low performance
0 - 25
One green LED +
two yellow LEDs
Medium low
performance
25 - 50
One green LED +
three yellow LEDs
Medium high
performance
50 - 75
One green LED +
four yellow LEDs
High performance
75 - 100
Table 13 Operational status indication
0
50
100
150
200
250
300
350
400
p
[mbar]
[l/min]
1
2
3
0 1 2 3 4 5 6 7 8 9 10 11 12 13 14 15 16 17 18 19 20 21 22 23 24 25
6720808928-58.1Wo
Setting
Maximum head (nominal)
Maximum P1(nominal)
Curve 1
4 m
25 W
Curve 2
5 m
33 W
Curve 3
6 m
39 W
Table 14 Modulating speed characteristics
6720808928-23.1Wo
60
50
40
30
20
10
0
0.0 0.2 0.4 0.6 0.8 1.0 1.2 1.4 1.6 1.8 2.0 2.2 2.4 2.6 2.8 3.0 3.2 3.4 3.6
0.0 0.2 0.4 0.6 0.8 1.0 1.2 1.4 1.6 1.8 2.0 2.2 2.4 2.6 2.8 3.0 3.2 3.4 3.6
0
1
2
3
4
5
6
7
Q [m
3
/h]
Q [l/s]
Q [m
3
/h]
p
H
[kPa] [m]
P1
0
10
20
30
40
50
[W]
0.0
0.1
0.2
0.3
0.4
0.5
0.6
0.7
0.8
0.9
1.0
Summary of Contents for Worcester Greenstar HIU
Page 65: ...6 720 808 928 2017 06 65 Notes ...
Page 66: ...6 720 808 928 2017 06 66 Notes ...


