Advanced settings
7
Advanced settings
7.1 "Graph" screen
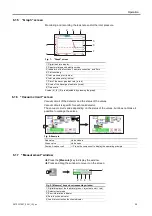
Access the "Graph" screen by pressing
.
7.1.1 Description
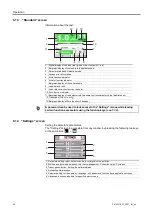
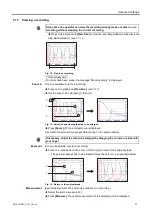
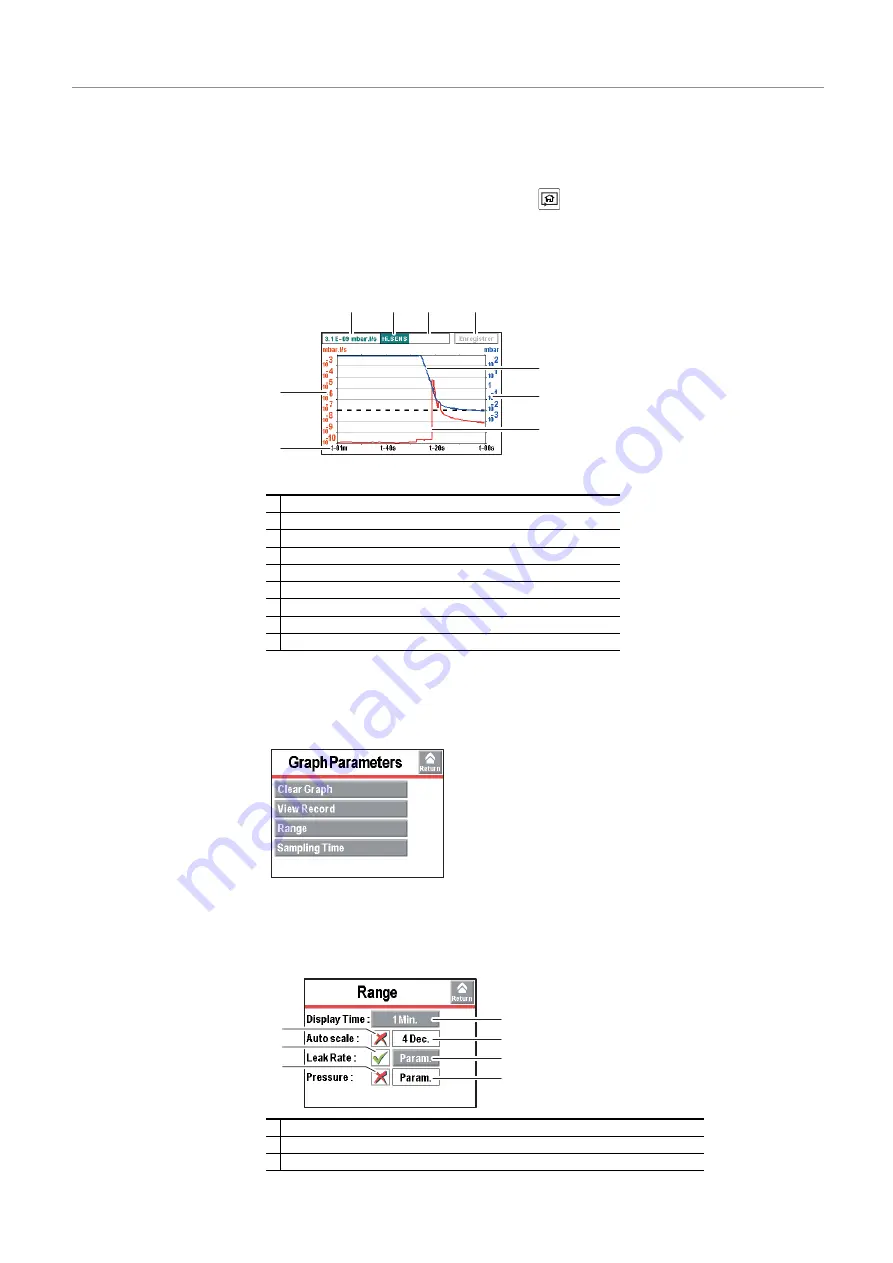
Monitoring and recording the leak rate and/or the inlet pressure.
Fig. 9: "Graph" screen
Scales (6), (8), (9) are adjustable by pressing the graph.
7.1.2 Settings
Access the graph settings menu by pressing the graph.
7.1.3 Scales setting
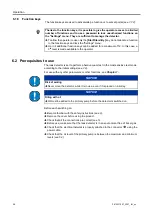
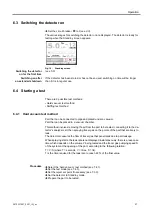
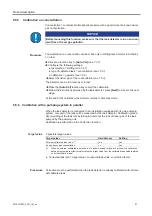
Press on the graph and on
[Scale]
to change the graph parameters.
1 Digital leak rate display
2 Detector status and detection mode
3 Indicators of the functions ’Leak rate correction’ and ’Zero’
4 Plot recording
5 Inlet pressure plot (in blue)
6 Inlet pressure scale (in blue)
7 Plot of the tracer gas leak rate (in red)
8 Scale of the tracer gas leak rate (in red)
9 Time scale
1
2
3
4
8
6
7
5
9
1 Period of time displayed on the screen
2 Activating/Deactivating the automatic scale
3 Setting the automatic scale
1
3
5
7
2
4
6
34
0870231897_0001_IM_en
Summary of Contents for 0659230708
Page 79: ...Note 79 0870231897_0001_IM_en...

