CoreWatch Users Guide
267
Chapter 16: Monitoring Real-Time Performance
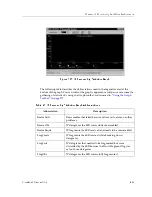
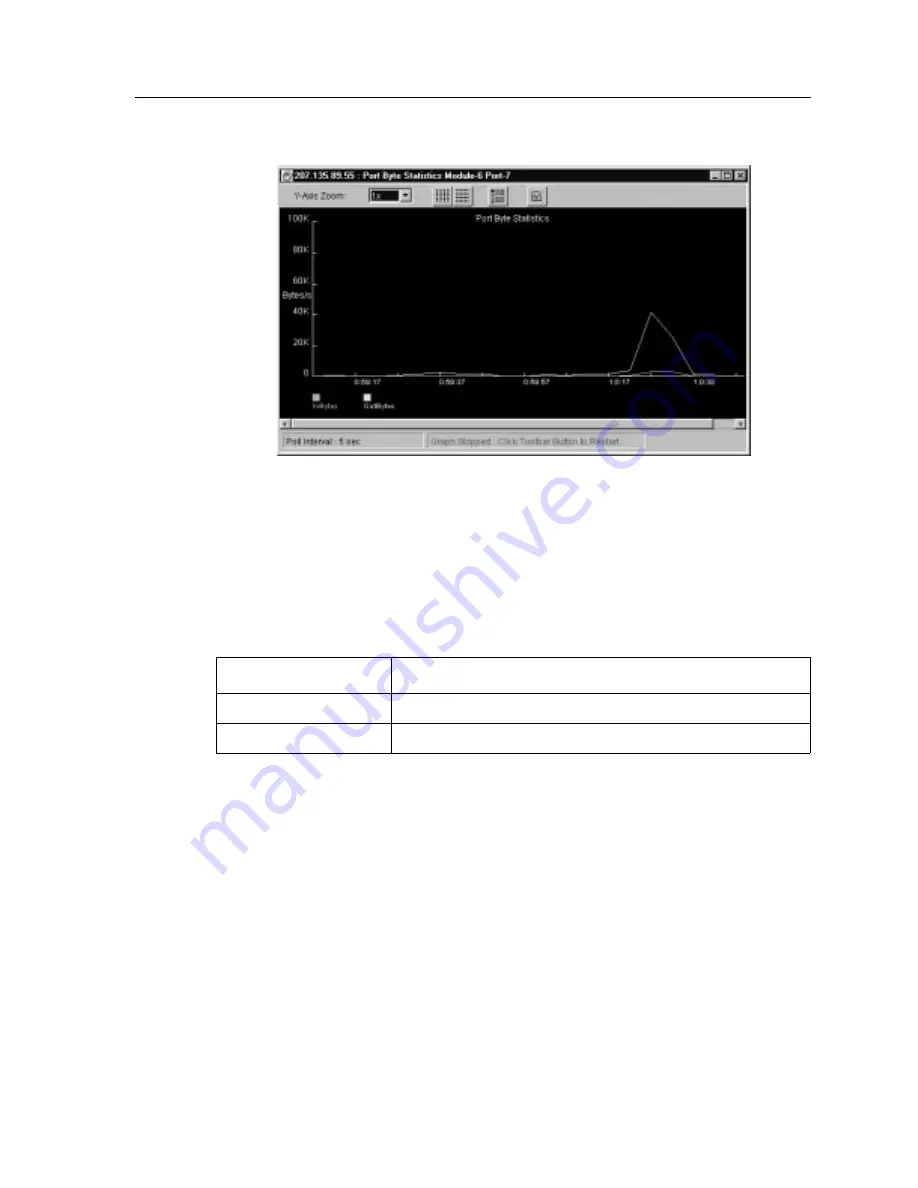
Figure 176. Port Byte Statistics Graph
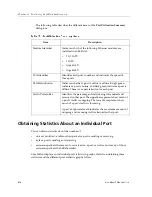
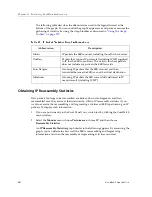
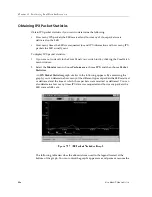
The following table describes the abbreviations used in the legend located at the
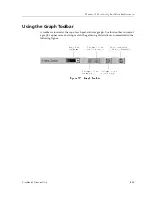
bottom of the graph. You can control the graph's appearance and pause or resume the
gathering of statistics by using the Graph toolbar as discussed in
“Using the Graph
Toolbar” on page 277
.
Obtaining Port Error Statistics
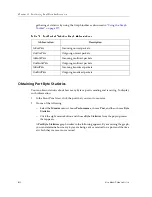
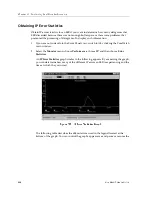
You can obtain statistics about the erroneous packets that are sent or received on a port as
well as how many of those erroneous packets the SSR discarded. To display such
information:
1.
In the Front Panel view, click the port that you want to monitor.
2.
Do one of the following:
–
Select the Monitor menu, choose Performance, choose Port, and then choose Error
Statistics
.
–
Click the right mouse button and choose Error Statistics from the pop-up menu
that appears.
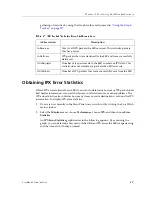
Table 38. Port Byte Statistics Graph Abbreviations
Abbreviation
Description
InBytes
Bytes received on the port.
OutBytes
Bytes sent out on the port.
Summary of Contents for SSR-ATM29-02
Page 1: ...CoreWatch User s Guide 9032564...
Page 2: ......
Page 6: ...Notice vi...
Page 14: ...Contents 14 CoreWatch User s Guide...
Page 18: ...Preface 18 CoreWatch User s Guide...
Page 134: ...Chapter 9 Configuring Unicast Routing on the SSR 134 CoreWatch User s Guide...
Page 194: ...Chapter 12 Configuring QoS on the SSR 194 CoreWatch User s Guide...
Page 234: ...Chapter 13 Configuring Security on the SSR 234 CoreWatch User s Guide...
Page 258: ...Chapter 15 Checking System Status 258 CoreWatch User s Guide...
Page 278: ...Chapter 16 Monitoring Real Time Performance 278 CoreWatch User s Guide...
Page 316: ...Chapter 18 Checking the Status of Routing Tables 316 CoreWatch User s Guide...
Page 326: ...Chapter 20 Monitoring Faults 326 CoreWatch User s Guide...
Page 330: ...Chapter 21 Obtaining Reports 330 CoreWatch User s Guide...
Page 344: ...Appendix B CoreWatch Menus 344 CoreWatch User s Guide...


