20
Questions about Cala Trio? Visit CalaTrio.com/HCPFAQs
LBL-5122 Rev C NOV 2019
on average had moderate tremors, as demonstrated
by an average baseline Bain & Findley ADL total score
of 45.4
(out of 100)
, an average baseline upper-limb
TETRAS score of 25.3
(out of 64)
, and an average Quality
of life in Essential Tremor Questionnaire (QUEST) score
of 0.31
(out of 1)
. There were no statistical differences
between the treatment and sham groups in the enrolled
population related to subject demographics or baseline
characteristics.
In the EAP and PP, there was a statistical difference or
borderline statistical difference between the treatment
and sham groups in their baseline TETRAS Spiral rating
(p = 0.021 and p = 0.065, respectively)
. Baseline spiral
rating was accounted for in the primary effectiveness
endpoint analysis of covariance model.
Primary Endpoint
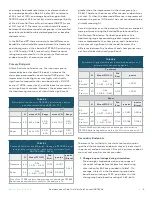
After 40 minutes of device use, the treatment group
improved by an estimated 0.56 points, whereas the
sham group improved by an estimated 0.39 points. The
improvement in both groups was highly statistically
significant compared to their own baseline
(p < 0.0001
and p = 0.0096, respectively)
, and the baseline score was
not a significant covariate. However, the improvement in
the treatment group was not statistically significantly
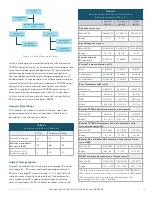
TABLE 4
Descriptive statistics of TETRAS Spiral ratings before
and after stimulation (EAP; N = 77)
Baseline
Post
N
mean ± SD
Range
mean ± SD
Range
Treatment
40
2.95 ± 0.68
2.00 -
4.00
2.41 ± 1.00
0.50 -
4.00
Sham
37
2.63 ± 0.52
2.00 -
4.00
2.23 ± 0.80
0.50 -
4.00
TABLE 5
Primary Effectiveness Endpoint: Change in TETRAS Spiral
ratings after stimulation - parameter estimates from
ANCOVA (EAP; N=76)
1
N
Mean (95%CI)
Std.
Error
p-value
p-value
(Group)
Treatment
40
-0.56
( -0.76 - -0.35)
0.102
<.0001
0.263
Sham
36
-0.39
( -0.60 - -0.17)
0.108
0.0006
1
One of the 77 EAP subjects had missing post-stimulation TETRAS
Spiral rating data; therefore, the N for this analysis is 76.
TABLE 6
Summary of population-based sensitivity analyses of
primary effectiveness endpoint
Treatment
N
Mean (95%CI)
Std.
Error
p-value
All
Enrolled
1
48
-0.47
( -0.65 - -0.30)
0.088
<.0001
Per-
Protocol
30
-0.66
( -0.89 - -0.42)
0.119
<.0001
Sham
N
Mean (95%CI)
Std.
Error
p-value
p-value
(Group)
All
Enrolled
1
43
-0.39
( -0.57 - -0.20)
0.093
<.0001
0.5208
Per-
Protocol
30
-0.37
( -0.61 - -0.13)
0.119
0.0028
0.1034
1
Two of the 93 enrolled subjects had missing post-stimulation
TETRAS Spiral rating data; therefore, the N for this analysis is 91.
greater than the improvement in the sham group
(p =
0.263)
. Therefore, the primary effectiveness endpoint was
not met. Further, the observed difference in improvement
between the groups
(0.17 points)
was not considered to be
clinically meaningful.
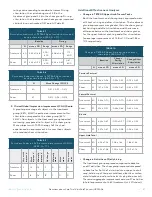
Sensitivity analyses on the primary effectiveness endpoint
were performed using the Enrolled Population and the
Per-Protocol Population. For both populations, the
treatment group experienced a greater improvement in
tremor compared to the sham group, and the baseline
score was not significant in the model; however, the
difference between the treatment and sham groups was
not found to be statistically significant.
Secondary Endpoints
To account for multiplicity, the statistical analysis plan
specified that secondary endpoints may only be tested if
the primary endpoint was met. Since the primary endpoint
was not met p-values are not provided.
1. Change in spiral ratings during stimulation:
The average, standard deviation, and ranges of
the spiral ratings before
(at baseline)
and during
stimulation for EAP are provided in Table 7. On
average, subjects in the treatment group had a
baseline spiral rating of 2.95, and subjects in the
sham group had a baseline rating of 2.63; both


