22
Questions about Cala Trio? Visit CalaTrio.com/HCPFAQs
LBL-5122 Rev C NOV 2019
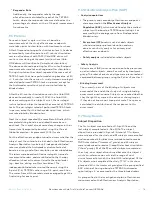
TABLE 11
Change in ADLs after stimulation (EAP; N=77)
Treatment
N
Baseline mean
± SD
Change mean
± SD
Use a spoon to drink
soup
40
3.18 ± 0.78
-0.78 ± 0.89
Hold a cup of tea
40
2.95 ± 0.85
-1.03 ± 0.73
Pour milk from a
bottle or carton
40
2.78 ± 1.03
-0.70 ± 0.76
Dial a telephone
40
2.23 ± 0.89
-0.70 ± 0.79
Pick up your change
in a shop
40
2.03 ± 0.86
-0.53 ± 0.68
Insert an electric
plug into a socket
40
1.83 ± 0.78
-0.33 ± 0.69
Unlock your front
door with a key
40
2.23 ± 0.86
-0.60 ± 0.87
ADL subset total
40
17.20 ± 4.10
-4.65 ± 2.80
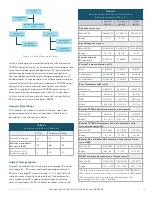
Sham
N
Baseline mean
± SD
Change mean
± SD
Use a spoon to drink
soup
37
3.00 ± 0.85
-0.59 ± 0.76
Hold a cup of tea
37
2.65 ± 0.92
-0.57 ± 0.80
Pour milk from a
bottle or carton
37
2.59 ± 0.86
-0.59 ± 0.72
Dial a telephone
37
2.00 ± 0.91
-0.30 ± 0.62
Pick up your change
in a shop
37
1.92 ± 0.89
-0.05 ± 0.62
Insert an electric
plug into a socket
37
1.76 ± 0.80
-0.24 ± 0.55
Unlock your front
door with a key
37
1.86 ± 0.67
-0.16 ± 0.55
ADL subset total
37
15.78 ± 3.87
-2.51 ± 2.73
»
TETRAS Spiral Responder Rates:
During stimulation, the responder rate
(% of subjects
with a ≥ 0.5-point improvement)
in the TAPS treatment
group was 47.5% compared to 37.8% in the sham
group. After stimulation, the responder rate was
50.0% compared to 38.9% in the sham group. During
stimulation, the responder rate
(% of subjects with a
≥ 1.0-point improvement)
in the TAPS treatment group
was 10.0% compared to 16.2% in the sham group.
After stimulation, the responder rate was 27.5%
compared to 16.7% in the sham group.
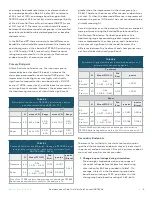
TABLE 12
TETRAS Spiral responder rate during and
after stimulation (EAP; N=77)
During Stimulation
After Stimulation
Responder Rate
(95% CI)
Responder Rate
(95% CI)
Treatment
(N=40)
Sham
(N=37)
Treatment
(N=40)
Sham
(N=36)
% of
subjects with
a ≥ 0.5-point
improvement
47.5%
(31.5% -
63.9%)
37.8%
(22.5% -
55.2%)
50.0%
(33.8% -
66.2%)
38.9%
(23.1% -
56.5%)
% of
subjects with
a ≥ 1.0-point
improvement
10.0%
(2.8% -
23.7%)
16.2%v
(6.2%-
32.0%)
27.5%
(14.6%-
43.9%)
16.7%
(6.4%-
32.8%)
»
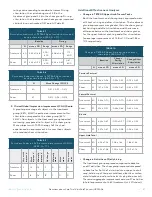
TETRAS Upper Limb Tremor Responder Rates
The majority of the treatment subjects were
responders
(% of subjects with a ≥ 0.5 point
improvement)
for each of the TETRAS Upper Limb
Tremor tasks
(forward postural, lateral postural, and
kinetic)
both during and after stimulation. Moreover,
for each of the tasks, the responder rate in the
treatment group was higher than the responder rate
in the sham group. There was a difference in the
responder rates between the treatment and sham
groups for the average TETRAS Upper Limb score
(65.0% vs 32.4%).
TABLE 13
TETRAS Upper Limb responder rates during and after
stimulation (EAP; N=77)
During Stimulation
After Stimulation
Responder Rate
1
(95% CI)
Responder Rate
1
(95% CI)
Treatment
(N=40)
Sham
(N=37)
Treatment
(N=40)
Sham
(N=36)
Forward
Postural
65.0%
(48.3% -
79.4%)
51.4%
(34.4% -
68.1%)
75.0%
(58.8% -
87.3%)
51.4%
(34.4% -
68.1%)
Lateral
Postural
57.5%
(40.9% -
73.0%)
48.6%
(31.9% -
65.6%)
62.5%
(45.8% -
77.3%)
45.9%
(29.5% -
63.1%)
Kinetic
62.5%
(45.8% -
77.3%)
51.4%
(34.4% -
68.1%)
60.0%
(43.3% -
75.1%)
54.1%
(36.9% -
70.5%)
Average
TETRAS
Upper Limb
tremor
52.5%
(36.1% -
68.5%)
32.4%
(18.0% -
49.8%)
65.0%
(48.3% -
79.4%)
32.4%
(18.0% -
49.8%)
1
Responder rate defined as percentage of subjects with
improvement of ≥ 0.5 points


