Chapter 7: Operation
System statistics
System statistics
This section describes how to use the system statistics pages to manage the performance of the
PTP 650 link, use the following web pages:
System Statistics page
Menu option: System > Statistics. Use this page to check system statistics.
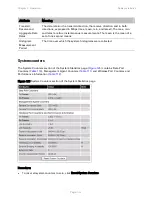
System histograms
The System Histograms section of the System Statistics page (
) contains eight
diagnostic attributes that are presented as arrays of four elements (
Figure 124 System Histograms section of the System Statistics page
The element arrays represent the following:
•
Max: The maximum value measured over the last hour.
•
Mean: The mean of a set of values recorded at one second intervals over the last hour.
•
Min: The minimum value measured over the last hour.
•
Latest: The latest value measured.
The values are calculated over the time that has elapsed since the link was established or since the
measurement period was reset.
Page
7-32


