Managing perform ance
Chapt er 7: Operat ion
7- 64
phn- 2513_004v000 ( Oct 2012)
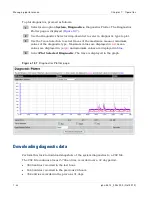
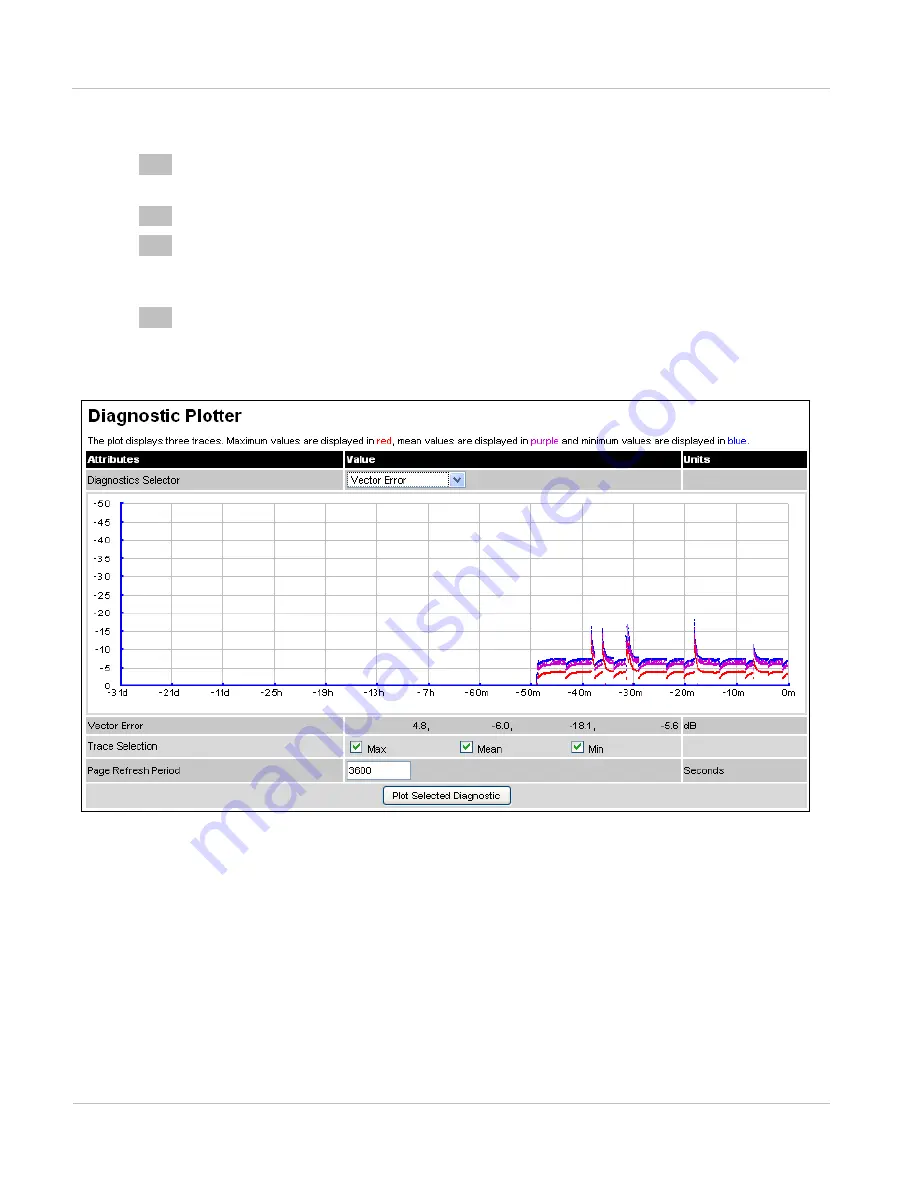
To plot diagnostics, proceed as follows:
1
Select menu option
System, Diagnostics,
Diagnostics Plotter. The Diagnostics
Plotter page is displayed (
2
Use the Diagnostics Selector drop-down list to select a diagnostic type to plot.
3
Use the Trace Selection to select traces of the maximum, mean or minimum
values of the diagnostic type. Maximum values are displayed in
red
, mean
values are displayed in
purple
and minimum values are displayed in
blue
.
4
Select
Plot Selected Diagnostic
. The trace is displayed in the graph.
Figu r e 1 9 7
Diagnost ics Plot t er page
Downloading diagnostic data
Perform this task to download snapshots of the system diagnostics to a CSV file.
The CSV file contains at most 5784 entries, recorded over a 32 day period:
•
3600 entries recorded in the last hour.
•
1440 entries recorded in the previous 24 hours.
•
744 entries recorded in the previous 31 days
.
Summary of Contents for PTP 800 Series
Page 1: ...Cambium PTP 800 Series User Guide System Release 800 05 02 ...
Page 40: ...Licensing requirements About This User Guide 10 phn 2513_004v000 Oct 2012 ...
Page 232: ...Limit of liability Chapter 3 Legal information 3 22 phn 2513_004v000 Oct 2012 ...
Page 322: ...Radiation hazard assessm ent Chapter 4 Reference information 4 90 phn 2513_004v000 Oct 2012 ...
Page 428: ...Replacing IRFU components Chapter 5 Installation 5 106 phn 2513_004v000 Oct 2012 ...
Page 630: ...Using recovery mode Chapter 7 Operation 7 78 phn 2513_004v000 Oct 2012 ...


