Commissioning and use during operation
Advanced Graphic Data Manager
84
"Extras" menu items,
submenu:
Display/operation
Description
Change group
Select the group which should be displayed.
Note:
only the active groups are displayed.
Picklist: group 1 – x
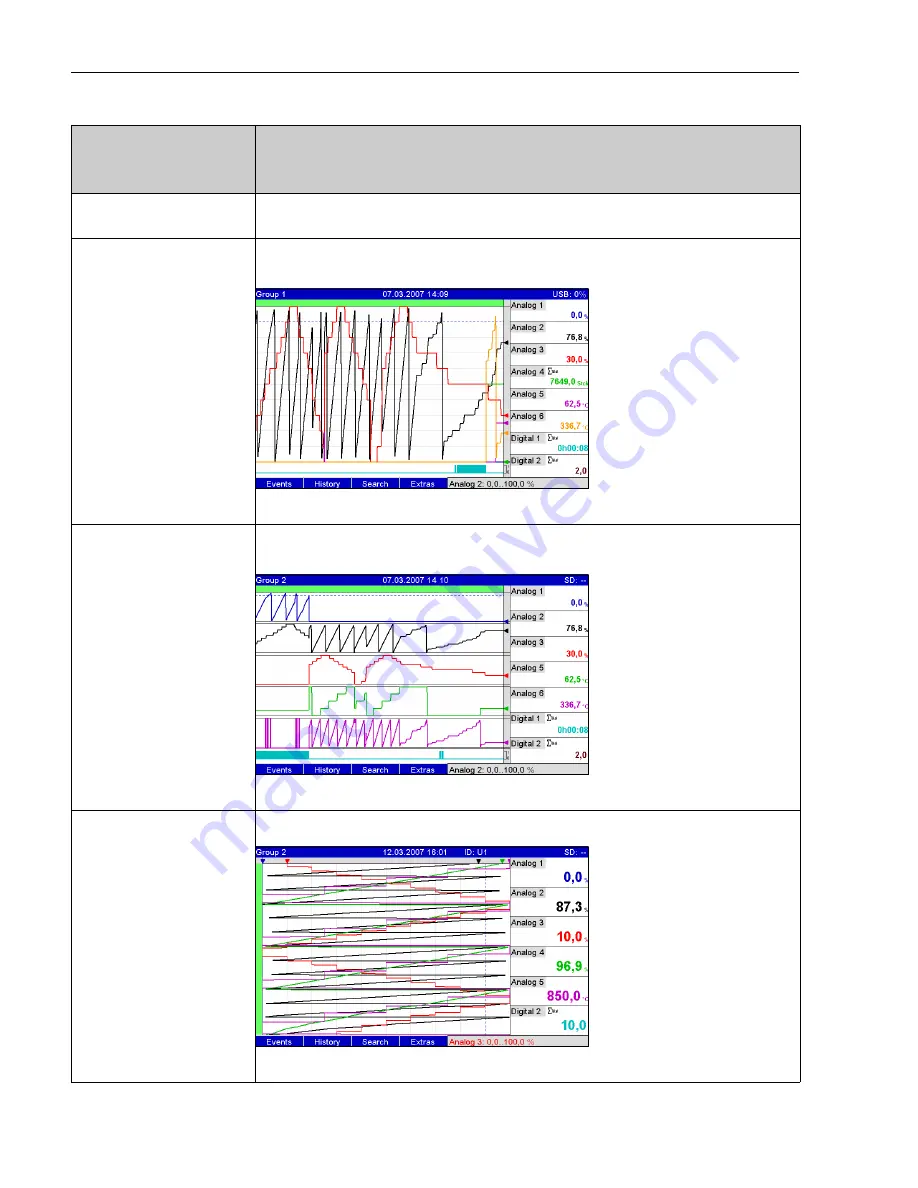
Curve
All channels are displayed over the total width. Maximum resolution in upscale direction. All the channels in a group
are displayed horizontally (from right to left).
Fig. 54:
Curve display
Curve in ranges
All the channels in a group are displayed horizontally (from right to left). Each channel is displayed in its own chart zone.
Accuracy of the plot is not influenced in this display mode.
Fig. 55:
Curve in ranges
Waterfall
All the channels in a group are displayed vertically (from top to bottom).
Fig. 56:
Waterfall


