Section 7. Installation
265
7.7.9.2.2 Calculations
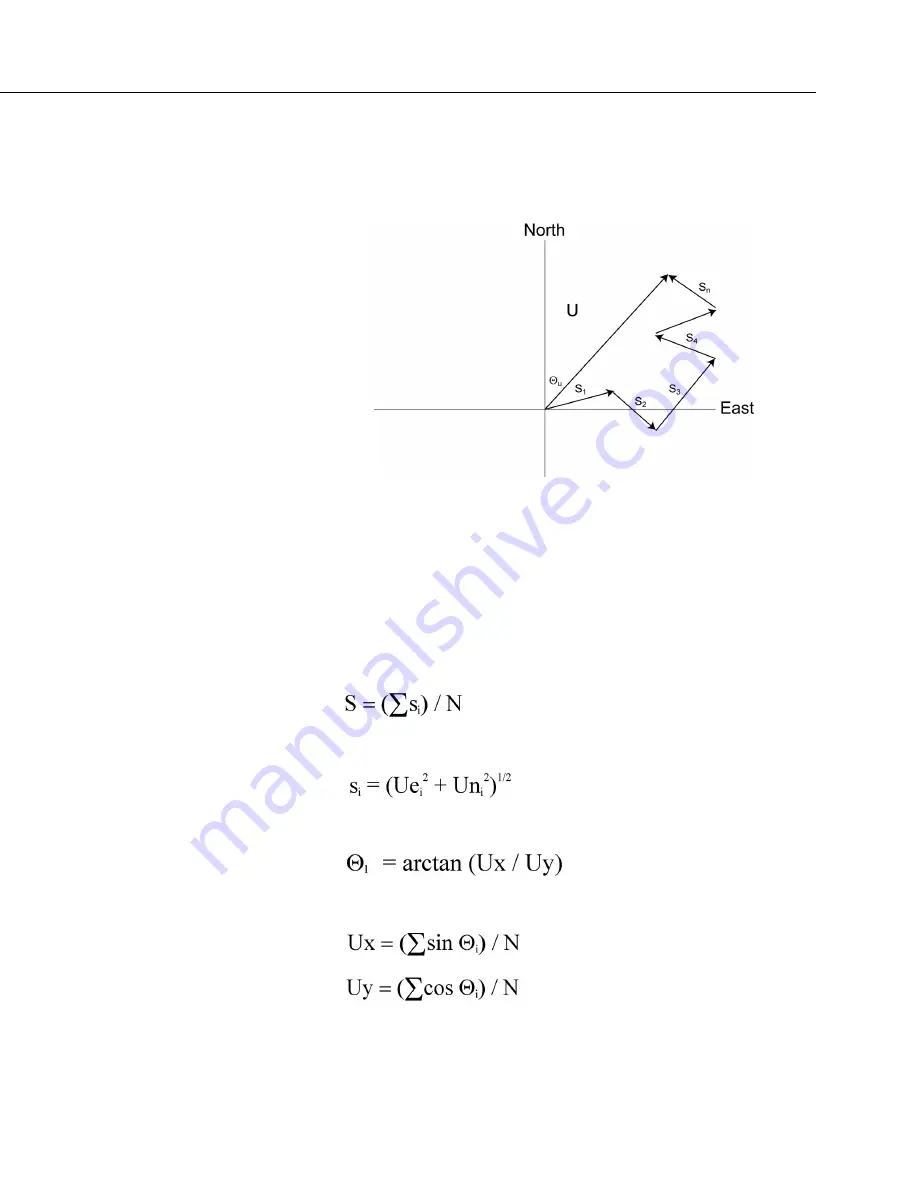
Input Sample Vectors
FIGURE 52: Input Sample Vectors
In figure
Input Sample Vectors
(p. 265),
the short, head-to-tail vectors are the input
sample vectors described by s
i
and Θ
i
, the sample speed and direction, or by Ue
i
and Un
i
, the east and north components of the sample vector. At the end of data
storage interval T, the sum of the sample vectors is described by a vector of
magnitude U and direction Θu. If the input sampl
e interval is t, the number of
samples in data storage interval
T
is
N = T / t
. The mean vector magnitude is
Ū =
U / N
.
Scalar mean horizontal wind speed, S:
where in the case of orthogonal sensors:
Unit vector mean wind direction,
where
Summary of Contents for CR6 Series
Page 2: ......
Page 4: ......
Page 6: ......
Page 32: ......
Page 36: ......
Page 38: ......
Page 76: ...Section 5 Overview 76 FIGURE 20 Half Bridge Wiring Example Wind Vane Potentiometer ...
Page 80: ...Section 5 Overview 80 FIGURE 23 Pulse Input Wiring Example Anemometer ...
Page 136: ......
Page 454: ...Section 8 Operation 454 FIGURE 104 Narrow Sweep High Noise ...
Page 459: ...Section 8 Operation 459 FIGURE 106 Vibrating Wire Sensor Calibration Report ...
Page 535: ...Section 8 Operation 535 8 11 2 Data Display FIGURE 121 CR1000KD Displaying Data ...
Page 537: ...Section 8 Operation 537 FIGURE 123 CR1000KD Real Time Custom ...
Page 538: ...Section 8 Operation 538 8 11 2 3 Final Storage Data FIGURE 124 CR1000KD Final Storage Data ...
Page 539: ...Section 8 Operation 539 8 11 3 Run Stop Program FIGURE 125 CR1000KD Run Stop Program ...
Page 541: ...Section 8 Operation 541 FIGURE 127 CR1000KD File Edit ...
Page 546: ......
Page 552: ......
Page 610: ...Section 11 Glossary 610 FIGURE 137 Relationships of Accuracy Precision and Resolution ...
Page 612: ......
Page 648: ......
Page 650: ......
Page 688: ......
Page 689: ......


