Section 7. Installation
301
7.7.13 Measurement: Fast Analog Voltage
Measurement speed requirements vary widely. The following are examples:
•
An agricultural weather station measures weather and soil sensors once
every 10 seconds.
•
A station that warns of rising water in a stream bed measures at 10 Hz.
•
A station measuring mechanical stress measures at 1000 Hz.
•
A station measuring the temperature of a grass fire measures at 93750
Hz.
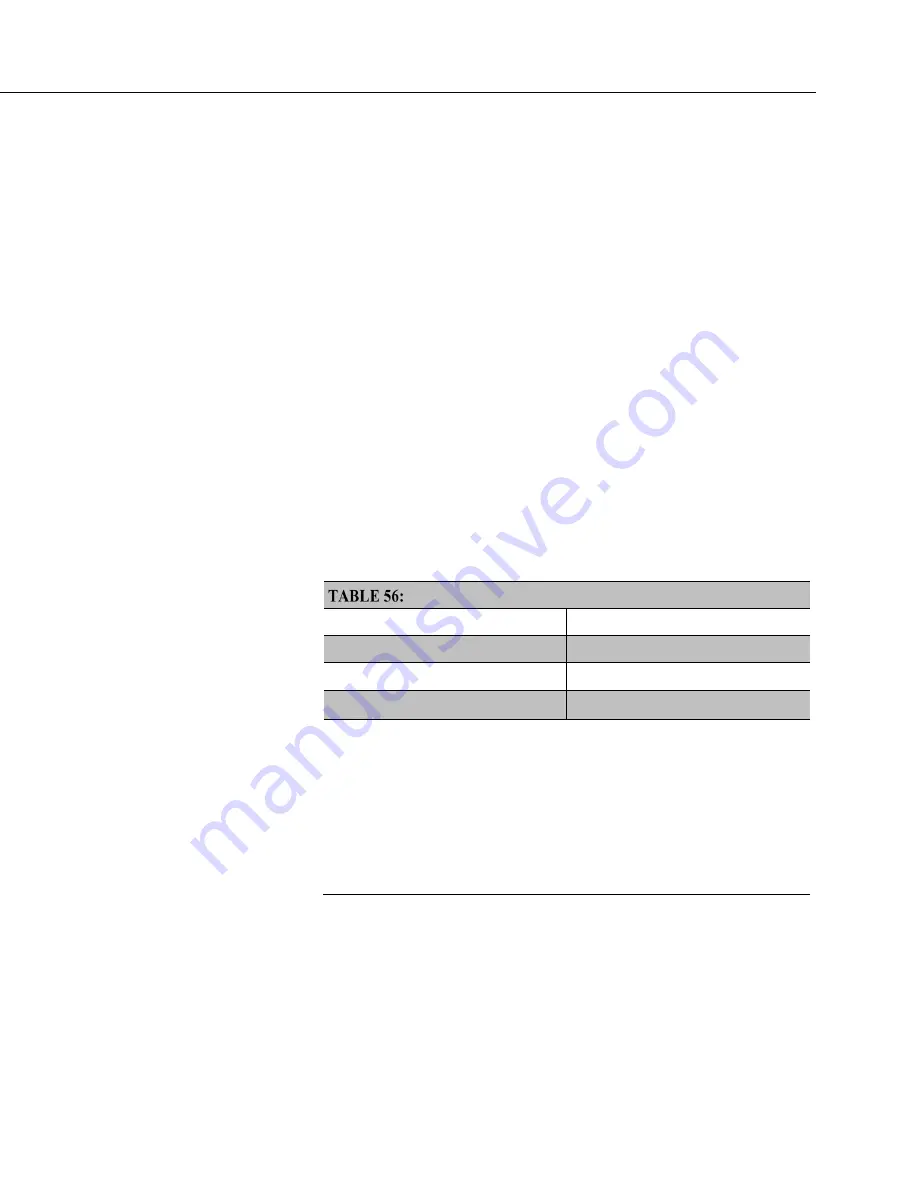
TABLE: Maximum Measurement Speeds Using VoltSE()
(p. 301)
lists maximum
speeds at which single-ended voltage inputs can be measured using the
VoltSE()
instruction. Differential measurements are slower. That fact that you can program
the CR6 to measure at these speeds, however, does not mean necessarily that you
should. The integrity of measurements begins to come into question when
fN1
,
which is the reciprocal of signal integration time, is larger than 15000, and when
SettlingTime
is less than 500 µs. While programming the CR6 for fast
measurements, you must balance the need for data integrity with the need for
speed.
Maximum Measurement Speeds Using VoltSE()
VoltSE()
Measurement Type
Maximum Speed on
n
Channels
Fast Scan()
100 Hz, n = 10
Cluster Burst
1,2
100 Hz,
n
= 2
Dwell Burst
1,3
≤ 45358 samples @ 93750 Hz,
n
= 1
1
Bursts are programmed episodes of rapid analog measurements that cannot
be maintained continuously. Input channels can be single-ended
U
terminals
or differential
U
/
U
terminal pairs. Bursts require pipeline mode and may
require additional
Scan()
buffers. Test specific applications thoroughly before
deployment.
2
Cluster bursts loop through a series of channels, one measurement per
channel, until the programmed loop count is complete.
3
Dwell bursts sit on one channel until the programmed measurement count is
complete.
You can make fast measurements with the following instructions:
•
Single-Ended Instrucitons:
o
TCSe()
o
BrHalf()
Summary of Contents for CR6 Series
Page 2: ......
Page 4: ......
Page 6: ......
Page 32: ......
Page 36: ......
Page 38: ......
Page 76: ...Section 5 Overview 76 FIGURE 20 Half Bridge Wiring Example Wind Vane Potentiometer ...
Page 80: ...Section 5 Overview 80 FIGURE 23 Pulse Input Wiring Example Anemometer ...
Page 136: ......
Page 454: ...Section 8 Operation 454 FIGURE 104 Narrow Sweep High Noise ...
Page 459: ...Section 8 Operation 459 FIGURE 106 Vibrating Wire Sensor Calibration Report ...
Page 535: ...Section 8 Operation 535 8 11 2 Data Display FIGURE 121 CR1000KD Displaying Data ...
Page 537: ...Section 8 Operation 537 FIGURE 123 CR1000KD Real Time Custom ...
Page 538: ...Section 8 Operation 538 8 11 2 3 Final Storage Data FIGURE 124 CR1000KD Final Storage Data ...
Page 539: ...Section 8 Operation 539 8 11 3 Run Stop Program FIGURE 125 CR1000KD Run Stop Program ...
Page 541: ...Section 8 Operation 541 FIGURE 127 CR1000KD File Edit ...
Page 546: ......
Page 552: ......
Page 610: ...Section 11 Glossary 610 FIGURE 137 Relationships of Accuracy Precision and Resolution ...
Page 612: ......
Page 648: ......
Page 650: ......
Page 688: ......
Page 689: ......


