background image

OBS-3A Turbidity and Temperature Monitoring System 

3.1  Ships With 

CSI pn 21229 Accessory Kit 
ResourceDVD 
CSI pn 29225 HydroSci Software on DVD 

4.  Overview 

The heart of the OBS-3A is an OBS

®

 sensor for measuring turbidity and 

suspended solids concentrations by detecting near infrared (NIR) radiation 
scattered from suspended particles.  With a unique optical design, OBS sensors 
perform better than most in situ turbidity sensors in the following ways: 

1.


Small size and sample volume, 

2.


Linear response and wide dynamic range, 

3.


Insensitivity to bubbles and organic matter, 

4.


Rejects effects of ambient light and temperature change. 

The OBS-3A includes a temperature sensor and may be equipped with pressure 
and conductivity sensors.  Batteries and electronics are contained in a housing 
capable of operating at depths of up to 300 meters, depending on which 
pressure sensor is installed.  A survey cable may be used to tow the OBS-3A 
and a depressor weight by clamping a cable harness to the housing. 

Depending on the number of sensors and the statistics selected, the OBS-3A 
can log as many as 200,000 lines of data (one per hour for 23 years) including: 
time, date, depth, nephelometric turbidity units (NTUs), °C, and salinity.  
When sampling with a full suite of sensors, the unit will run about 300 hours.  
When using the instrument for surveys, the data are captured by a PC running 
the HydroSense software in the log file created at initialization. 

4.1  OBS Sensor 

The OBS sensor consists of an infrared-emitting diode (IRED) with a peak 
wavelength of 875 nm, four photodiodes, and a linear temperature transducer.  
The IRED produces a conical beam with half-power points at 50° (FIGURE 
4-1).  The IR scattered between 140° and 160° is detected after passing through 
a daylight-rejection filter and is proportional to turbidity and sediment 
concentration.  See Section 5, 

Specifications

Summary of Contents for OBS-3A

Page 1: ...OBS 3A Turbidity and Temperature Monitoring System Revision 7 13 C o p y r i g h t 2 0 0 7 2 0 1 3 C a m p b e l l S c i e n t i f i c I n c ...

Page 2: ......

Page 3: ...removing reinstalling and shipping defective products to Campbell Campbell will return such products by surface carrier prepaid within the continental United States of America To all other locations Campbell will return such products best way CIP Port of Entry INCOTERM 2010 prepaid This warranty shall not apply to any products which have been subjected to modification misuse neglect improper servi...

Page 4: ...ng container Campbell Scientific s shipping address is CAMPBELL SCIENTIFIC INC RMA _____ 815 West 1800 North Logan Utah 84321 1784 For all returns the customer must fill out a Statement of Product Cleanliness and Decontamination form and comply with the requirements specified in it The form is available from our web site at www campbellsci com repair A completed form must be either emailed to repa...

Page 5: ...S Sensor 5 5 4 Other Data 5 5 5 Physcial 6 6 Operations 6 6 1 Instrument Setup 6 6 1 1 Mounting Suggestions 6 6 1 2 Battery Installation 8 6 2 Software Installation 9 6 3 Running HydroSci 10 6 4 Testing Sensors 12 6 5 Water Density and Barometric Corrections 13 6 6 Menus 13 6 7 Connection 14 6 8 OBS 3A Configuration 14 6 8 1 Information 14 6 8 2 Operations 15 6 8 3 Survey Configuration 20 6 8 4 Cy...

Page 6: ... Coatings 55 9 7 User serviceable Parts 55 10 Factors Affecting OBS Response 55 10 1 Particle Size 56 10 2 Suspensions with Mud and Sand 57 10 3 High Sediment Concentrations 58 10 4 Sediment Color 59 10 5 Water Color 59 10 6 Bubbles 60 10 7 Biological and Chemical Fouling 61 11 References 61 Figures 4 1 Anatomy of an OBS sensor 3 4 2 Optical particle detectors 3 5 1 Dimensions 6 6 1 Components 8 6...

Page 7: ...Table of Contents Tables 6 1 Working and Maximum Depths 7 7 1 Mixing Volumes for Formazin Standards 46 7 2 Sample Durations for Sediment Calibrations 48 9 1 Battery Life Hours 54 iii ...

Page 8: ...Table of Contents iv ...

Page 9: ...ressure sensor will rupture and the housing will flood Bright sun near the surface 2 meters or black colored sediments can cause erroneous OBS readings The OBS sensor must be kept clean to measure sediment concentration or turbidity accurately When cleaning the OBS 3A do not use MEK benzene toluene or electronic cleaners as they could damage the OBS window The conductivity sensor is very fragile a...

Page 10: ...ters depending on which pressure sensor is installed A survey cable may be used to tow the OBS 3A and a depressor weight by clamping a cable harness to the housing Depending on the number of sensors and the statistics selected the OBS 3A can log as many as 200 000 lines of data one per hour for 23 years including time date depth nephelometric turbidity units NTUs C and salinity When sampling with ...

Page 11: ...ailable pressure sensors are listed in TABLE 6 1 4 3 Optics and Turbidity Measurements Turbidity is the cloudy appearance of a liquid produced by light scattered from suspended matter It is an apparent optical property that depends on the size color and shape of scattering particles and the instrument used to measure it In accordance with standard method 2130B and ISO 7027 turbidity is usually mea...

Page 12: ...utiously Inconsistencies between instruments results from variations in light sources detectors optical configurations and turbidity standards Can turbidity be converted to suspended solids concentrations and vise versa In most situations conversions between turbidity and suspended solids concentrations will give misleading results because the conversion equates to an apparent optical property in ...

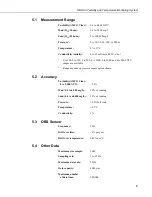
Page 13: ...0 to 2000 and 0 to 4000 NTU ranges are available 2 Range depends on pressure sensor option chosen 5 2 Accuracy Turbidity AMCO Clear 0 to 2 000 NTU 2 0 Mud 0 4 to 4 000 mg L 2 0 of reading Sand 0 4 to 60 000 mg L 3 5 of reading Pressure 0 5 full scale Temperature 0 5 C Conductivity 1 5 3 OBS Sensor Frequency 5 Hz Drift over time 2 per year Drift over temperature 0 05 per C 5 4 Other Data Maximum si...

Page 14: ... 5 5 Physcial Length diameter 362 mm 14 3 in 76 mm 3 0 in Weight w o batteries 1 5 kg 3 4 lb Weight submerged 0 2 kg 0 5 lb FIGURE 5 1 Dimensions 362 mm 14 3 in 76 mm 3 0 in USE HOSE CLAMPS HERE 6 Operations 6 1 Instrument Setup 6 1 1 Mounting Suggestions Maximum depth for the OBS 3A housing is 300 meters Working depths for individual instruments are limited by the installed pressure sensor If exc...

Page 15: ...mounting the unit to a frame or wire is to use large high strength nylon cable ties 7 6 mm or 0 3 in width or stainless steel hose clamps Use at least six cable ties or two hose clamps for redundancy Position the clamps on the inner 2 3rds of the pressure tube labeled USE HOSE CLAMPS HERE so stress is not transmitted to the ends see FIGURE 5 1 First cover the area s to be clamped with tape or 2 mm...

Page 16: ...m the end with the handle and pull the cap down and out of the housing Use caution if you have significantly changed elevation since the OBS 3A may be under pressure and the cap could pop out CAUTION Wipe water from inside walls of the tube with a paper towel FIGURE 6 2 Slide the battery clip back and insert the batteries with the positive terminal toward the clip Push the batteries down and slide...

Page 17: ...roSci before connecting the OBS 3A to the computer NOTE Insert the ResourceDVD and type OBS 3A in the product window Install the HydroSci software Follow the installation wizard to install the software This utility is your interface with the OBS 3A As part of the installation a system maintenance program is included Communication drivers exist on the CD The main purpose of this section is to expla...

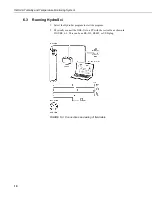
Page 18: ...em 6 3 Running HydroSci 1 Select the HydroSci program to start the program 2 Physically connect the OBS 3A to a PC with the test cable as shown in FIGURE 6 3 This can be an RS 232 RS485 or USB plug FIGURE 6 3 Connections and wiring of field cable 10 ...

Page 19: ... COM Port and Baud Rate at which to communicate Press the Connect button 4 Upon successful connection the Monitor screen will appear 5 Synchronize the OBS 3A clock with your PC by clicking Set OBS 3A Time 6 Configure your OBS 3A as desired For more information on configuration options see Section 6 8 OBS 3A Configuration 11 ...

Page 20: ...ing with your sensor click on the Connection tab and press the Disconnect button to disconnect from your sensor 6 4 Testing Sensors Before daily operations and deployments verify the instrument works by pressing Survey Configuration and Start Survey Then press Monitor to see the plot 12 ...

Page 21: ...c pressure Be sure to do this while the OBS 3A is at the surface Doing so when the instrument is submerged will result in large errors in the depth measurement The error will be approximately equal to the instrument depth when the correction is made Depending on the magnitude of barometric pressure fluctuations at the sampling site and the desired accuracy you may want to correct data for atmosphe...

Page 22: ...ou can also choose to connect and allow the test to continue to run If HydroSci cannot find an OBS 3A at the specified baud rate you can have HydroSci try each baud rate until the OBS 3A responds Use the radio buttons to make your selection and then press the Continue button 6 8 OBS 3A Configuration The configuration tab displays setup information allows you to perform operations such as putting t...

Page 23: ...o Sleep Press the Sleep button to put the OBS 3A in low power sleep mode This should be done when the OBS 3A will not be used for an extended period of time to conserve battery capacity Use the drop down button to specify how often the OBS 3A will wake to check for communication 15 ...

Page 24: ...on to clear all data stored in the OBS 3A HydroSci will confirm you want to clear all the data stored Stop Current Operation Press the Stop button to end any operation currently running in the OBS 3A Baud Rate Setting Specifies the baud rate at which the OBS 3A will communicate Use the drop down list to selct a baud rate and then press the Set Baud Rate button 16 ...

Page 25: ...e the OBS 3A is at the surface Doing so when the instrument is submerged will result in large errors in the depth measurement NOTE Change to RS 485 To switch from RS 232 communication to RS 485 communication press the RS 485 button and install the RS 485 converter Once the button is pressed you will no longer be able to communicate via RS 232 However if you accidently push this button the OBS 3A c...

Page 26: ...Coefficients The Coefficients box can be used to retrieve and save the coefficients stored in the OBS 3A that are used to calculate the output values for each sensor The saved files can be used to load the coefficients into the OBS 3A at a time later if necessary Press the Retrieve and Save Coefficients to File button to retrieve the coefficients from the OBS 3A and save them to a file on your com...

Page 27: ...le press the Load Coefficients from File button Select the appropriate file from the resulting browsing window and press Open You will be asked to confirm that you really want to replace the coefficients from the corresponding sensor Press Yes and the coefficients from the file will be loaded into the OBS 3A 19 ...

Page 28: ...onfiguration mode when operating the unit with a cable connection to a PC and when high data rates are desired Data can be logged with a PC at rates up to 120 lines per minute 2 Hz Before setting the survey configuration run a Barometric Correction from the Options screen Be sure to do this while the OBS 3A is at the surface Doing so when the instrument is submerged will result in large depth erro...

Page 29: ... not be saved if you choose not to log data to a file NOTE After the survey is started you can select the Monitor tab to view the data When you have finished logging data return to the OBS 3A Configuration tab and press the Stop Survey button to stop the survey If desirable save the configuration to the computer to be used at a later time by pressing Save Configuration To File button 21 ...

Page 30: ...ity and Temperature Monitoring System You can press the Load Configuration From File button to load a configuration that has previously been saved The configuration can then be edited and or started in the OBS 3A 22 ...

Page 31: ...ion Cyclic Configuration is used to record data internally in the 8 MB non volatile FLASH memory at regular intervals every 1 5 15 or 30 minutes Depending on the number of sensors measured and the statistics selected the OBS 3A can log as many as 200 000 lines of data one per hour for 23 years including time date depth NTUs C and salinity Before setting the survey configuration run a Barometric Co...

Page 32: ...Cyclic Survey button to begin logging data Go to the Connection tab and press Disconnect to disconnect from the OBS 3A Unplug the test cable Install dummy plug and locking sleeve The instrument is then ready for deployment Sensor Measurements Select the check boxes next to the sensor measurements you wish to make For Depth OBS NTU and OBS mg L use the drop down boxes next to Statistics to select t...

Page 33: ...on will produce a sample with 1500 measurements for each sensor o Depth This is the user s best estimate of the water depth when the OBS 3A is deployed It is an initial value needed by the unit to compute wave heights and correct for the attenuation of dynamic pressure with depth When depth is specified in the Wave Setup box the OBS 3A automatically measures height above bottom after reaching the ...

Page 34: ...uration cannot exceed 2048 NOTE o Power This indicates the percentage of time over the duration of a sample that sensors are ON Higher power levels mean larger samples better statistics and shorter battery life Lower levels spare the batteries but result in more random noise in sample statistics 6 8 5 Scheduled Configuration Scheduled Configuration is used to sample at specific times in hours and ...

Page 35: ...tton to save the configuration to be used at a later time You can press the Load Configuration From File button to load a configuration that has previously been saved The configuration can then be edited and or started in the OBS 3A Sensor Measurements Select the check boxes next to the sensor measurements you wish to make For Depth OBS NTU and OBS mg L use the drop down boxes next to Statistics t...

Page 36: ...d long period waves Ts 10 seconds o Record Rate Rate is the frequency of sampling for the duration of measurements All sensors are sampled at the same rate typically 2 5 10 or 25 times per second Hz For example a rate of 25 Hz for a 60 second duration will produce a sample with 1500 measurements for each sensor o Depth This is the user s best estimate of the water depth when the OBS 3A is deployed...

Page 37: ...tteries but result in more random noise in sample statistics Start Times This block is used to set up the sampling schedule You can manually set up to 24 times in each 24 hour period to perform a sample Select the check box for each sample time that you wish to set The time field will then be enabled Use the drop down box to select the hour of the day at which to take the sample Click on the minut...

Page 38: ...creen Be sure to do this while the OBS 3A is at the surface Doing so when the instrument is submerged will result in large depth errors See Section 6 5 Water Density and Barometric Corrections for more details All of the parameters for a setpoint configuration are described below After setting the parameters press the Start Setpoint Survey button to begin logging data Go to the Connection tab and ...

Page 39: ...econds that the OBS 3A is measuring its sensors The duration must always be less than the interval The minimum duration is five seconds and the maximum is 2048 rate The product of the rate and the duration cannot exceed 2048 NOTE o Rate Rate is the frequency of sampling for the duration of measurements All sensors are sampled at the same rate typically 2 5 10 or 25 times per second Hz For example ...

Page 40: ...le and the beginning of the next when an event is occurring The interval must be longer than the duration plus some time for statistical computations HydroSci will prompt you if too short an interval is selected Switches Determines when the OBS 3A will switch from slow to fast and from fast to slow logging Use the radio buttons to select one of the logic criteria 6 9 Monitor The Monitor screen can...

Page 41: ... axis and the salinity scale is on the right axis You can change chart properties by pressing the Chart Properties button Hold the right mouse button and use the mouse to pan through the data Zoom in on a graph by holding the left mouse button and dragging the mouse from top left to bottom right over the area to be zoomed Undo the zoom by holding the left mouse button and dragging the mouse from b...

Page 42: ...o scroll through the data Select the Pause Data Output check box to temporarily pause the table from updating If a survey is not currently running the Monitor screen shows the current Sensor Time and PC Time Press the Set OBS 3A Time button to set the OBS 3A time to the current PC time Select the Pause Clock Update check box to disable the clock updates 34 ...

Page 43: ...Format TOA5 Data is stored in a comma separated format Header information for each of the columns is included along with units of measure and output processing used OBS Data is stored separated by spaces Header information includes the OBS 3A serial number and firmware version and the data columns contained in the file Press the Save Data File to save the data file contents to a file on your compu...

Page 44: ...ready to stop select Let the sample continue to run If you selected Stop sampling data a screen will appear saying The OBS 3A has been successfully stopped Press OK Otherwise Let the sample continue to run will ask you if you would like to log data to a file Select Yes or No When you are ready to stop go to OBS 3A Configuration Operations press Stop under Stop Current Operation to end data collect...

Page 45: ... System 4 Go to View Data to save data in a file 5 Highlight the data with the start and end times you want The Data File Contents shows a preview of the data you have selected You can also click View Data File to view the complete data file 37 ...

Page 46: ... Data File The Save As screen will appear name your file and press Save When viewing data within View you have the ability to view graph and print the data from the file 6 10 2 Graphing and Printing To graph the data select which columns you wish to display They will be highlighted when selected 38 ...

Page 47: ...screen will appear with various graphing options Categories can be selected and unselected to appear in the graph Graph Width allows you to select the period the graph is showing and adjust how many data points show at once Printing and Exporting are done through pressing their respective buttons 39 ...

Page 48: ...e Monitoring System The spreadsheet of data can also be printed 6 11 Show Terminal The Show Terminal tab brings up a terminal screen that allows you to view the commands being sent to the OBS 3A and the responses that are returned 40 ...

Page 49: ... from HydroSci You are then able to unplug your sensor 6 13 Excel Spreadsheets To make an Excel spreadsheet from OBS 3A data start Excel and set file type to All Open a data file and select Delimited in Step 1 of 3 of the Text Import Wizard Click Next and select the delimiter Space Treat consecutive delimiters as one and none for Text qualifier In Step 3 of 3 select the General Column data format ...

Page 50: ...ta To erase the memory data on the OBS 3A go to OBS 3A Configuration Operations Clear OBS 3A Data Storage Erase Flash It will have you confirm that you wish to erase all the data from the OBS 3A By following this procedure data in the Flash memory is erased so be careful 42 ...

Page 51: ...ttle so stirring is not required AMCO Clear must be made specifically for the OBS sensor Formazin can be purchased from the Hach Company 800 227 4224 www hach com request the certificate of analysis when ordering it Hach also supplies premixed StablCal which is like formazin except that it can be stored for two years while maintaining 5 of its nominal NTU value We strongly advise that the same tur...

Page 52: ... fluorescent lighting and make field checks in the shade 4 Start the OBS 3A Utility Software and wake the OBS 3A 7 1 3 HydroSci Software Steps Open the calibration dialog box under OBS 3A Configuation Operations Calibration and click the Calibrate button Choose the units of calibration you would like to use NTU or mg L and then select OK Follow the instructions to place the OBS 3A in a turbidity s...

Page 53: ...estore Original Cal button to restore the original calibration and leave the calibration screen This restores the calibration before you entered the Calibration screen There is no way to restore the original factory calibration Once you leave the Calibration screen you will not be able to restore the original calibration WARNING 7 1 4 Making Turbidity Standards 1 For the zero NTU calibration point...

Page 54: ... more involved than for turbidity For a modest charge we will pre calibrate OBS sensors with sediment provided by users Call us for a quotation to perform this service The most common cause of errors in OBS data is improper calibration CAUTION Before proceeding with a sediment calibration review Section 10 Factors Affecting OBS Response to learn about factors that can influence the quality of your...

Page 55: ...s often have cohesive sticky mud with high organic rich flocculation Disaggregation of the flocs will reduce the particle size and change the OBS response Sediment or suspended solids concentration is the dry weight of sediment divided by the weight of the sample expressed in ppm or by the volume of sample in liters expressed as mg L Usually the disaggregated particles will be finer than untreated...

Page 56: ... with filtered water 2 Perform the calibration under fluorescent lighting 3 Based on the material select the appropriate sample duration from TABLE 7 2 TABLE 7 2 Sample Durations for Sediment Calibrations Sediment Seconds Clay 10 Silt 20 Fine Sand 40 4 Open the calibration the screen under OBS 3A Configuration Operation Calibration Calibrate and select mg L 5 Enter sediment concentration values 6 ...

Page 57: ...n 7 1 3 HydroSci Software Steps 11 After all sediment values have been logged follow Steps 4 through 7 of Section 7 1 3 HydroSci Software Steps to complete the calibration 7 3 Salinity Pressure and Temperature Calibrations Due to the specialized equipment involved for salinity pressure and temperature calibration it is recommended that the instrument be returned to Campbell Scientific Inc if any o...

Page 58: ...able is damaged or improperly connected 2 The OBS 3A is sleeping and will not wake up 3 The batteries are dead 4 The OBS 3A and PC are not set to the same baud rate or communication protocol RS 232 USB RS 485 a Click and check COM port settings on the Connection tab The default baud rate is 115 2 kB If the PC is not set to this speed follow the steps in Section 6 7 Connection to set it 50 ...

Page 59: ... switch the PC back to 115 2 kB and go to the next step c Reconnect the cable and try to connect again d Replace the main batteries see Section 6 1 2 Battery Installation and try to connect again e If you have a survey cable connect instrument to external power and try to connect again f Remove the unit from the pressure housing and press and release the RESET button Try to connect again 51 ...

Page 60: ...cleaned see Section 9 2 Pressure Sensor If the sensors appear to be in working order the digitizer or microcontroller may be damaged Such problems usually require factory service Bright sun near the surface 2 meters or black colored sediments cause erroneous OBS readings Do not survey in shallow water between 10 00 and 14 00 local time and avoid areas with suspended black mud Changing the water te...

Page 61: ...ne as needed until approximately 1 mm of epoxy has been removed Deeper polishing may damage the IR source Check the calibration of the sensor with formazin after cleaning with abrasives see Section 7 Calibration 9 2 Pressure Sensor The strain gage sensor is located under a perforated disk and spring clip FIGURE 6 1 that protects the Hastelloy diaphragm isolating it from water Do not touch the diap...

Page 62: ...wrench provided in the spares kit Grasp the handlebar turn the sensor end up and pull the cap straight out of the pressure housing tube Immediately wipe up any water from inside the tube Stand the unit up on the sensor end and remove the desiccant bags Slide the clip away from the batteries until the spent cells pop up and can be slid out of the tube Insert fresh batteries in the tube with the pos...

Page 63: ...BTA in many places so check applicable water quality regulations in your area before using TBTA coated OBS sensors Use of TBTA is the sole responsibility of the user 9 7 User serviceable Parts Alkaline D cells and the components of the 21229 Accessory Kit can be purchased as replacement parts Campbell Scientific model numbers and product descriptions follow CSI pn 20990 End Cap O ring CSI pn 21145...

Page 64: ...lts from laboratory experiments and natural material support this and indicate a wide range of backscatter associated with very fine mud and coarse sand about two orders of magnitude Laboratory tests with coarse silt to medium sand material show that sensitivity changes by a factor of about 3 5 see FIGURE 10 1 The significance is that size variations between the field and laboratory and within in ...

Page 65: ...ill change An OBS sensor calibrated for a fixed ratio of sand to mud will therefore indicate the correct concentration only part of the time There are no simple remedies for this problem The obvious thing to do is to take a lot of water samples and analyze them in the laboratory This is not always practical during storms when the errors are likely to be largest Do not rely solely on OBS sensors to...

Page 66: ... decreases with increasing sediment concentration For mud this occurs at concentrations greater than about 5 000 mg L FIGURE 10 3 shows a calibration in which sediment concentrations exceed 6 g l cause the output signal to decrease It is recommended not to exceed the specified turbidity or suspended sediment ranges unless calibrations extend over range A on FIGURE 10 3 0 5 10 Sediment Concentratio...

Page 67: ...rk Resulting errors will depend on the relative concentrations of colored sediments 0 2 4 6 8 Munsell Value Black 0 10 0 0 0 2 0 4 0 6 0 8 1 0 Infrared Reflectance Calcite Bytownite Actinolite Magnetite FIGURE 10 4 IR reflectance of minerals 10 5 Water Color Several OBS users have been concerned that color from dissolved substances in water samples not colored particles discussed in the previous s...

Page 68: ...0 and 160 and where the scattering intensities are nearly constant with the scattering angle Particle concentration has the most important effect in this region OBS sensors are also more sensitive to mineral particles than either bubbles or particulate organic matter by factors of four to six In most environments interference from these materials can therefore be ignored One notable exception is w...

Page 69: ...or Marine Geology 108 pp 151 159 Downing John and W E Asher 1997 The Effects of Colored Water and Bubbles on the Sensitivity of OBS Sensors American Geophysical Union Fall Meeting San Francisco CA Downing John and Reginald A Beach 1989 Laboratory Apparatus for Calibrating Optical Suspended Solids Sensors Marine Geology 86 pp 243 249 Gippel C J 1995 Potential of Turbidity Monitoring for Measuring t...

Page 70: ...erland T F P M Lane C L Amos and John Downing 2000 The Calibration of Optical Backscatter Sensors for Suspended Sediment of Varying Darkness Level Marine Geology 162 pp 587 597 U S Department of Agriculture 1994 National Handbook of Water Quality Monitoring Part 600 USDA SCS Washington DC U S Geological Survey 2003 National Field Manual of the Collection of Water Quality Data Book 9 Handbooks for ...

Page 71: ......

Page 72: ...tific Canada Corp CSC 11564 149th Street NW Edmonton Alberta T5M 1W7 CANADA www campbellsci ca dataloggers campbellsci ca Campbell Scientific Centro Caribe S A CSCC 300 N Cementerio Edificio Breller Santo Domingo Heredia 40305 COSTA RICA www campbellsci cc info campbellsci cc Campbell Scientific Ltd CSL Campbell Park 80 Hathern Road Shepshed Loughborough LE12 9GX UNITED KINGDOM www campbellsci co ...

Reviews: