A
A-9
Desktop Color Primer
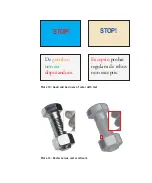
Raster images and vector images
Two broad categories of artwork can be printed from a personal computer to a color
printer: raster and vector images (plate 11).
A raster image, also referred to as a bitmap, is composed of a grid of pixels, each
assigned a particular color value. The grid, when sufficiently enlarged, resembles a
mosaic made from square tiles. Examples of raster images include scans and images
created in painting or pixel-editing applications, such as Photoshop and Painter.
The amount of data found in a raster image depends on its resolution and bit depth.
The resolution of a raster describes the compactness of the pixels and is specified in
pixels per inch (ppi). The bit depth is the number of bits of information assigned to
each pixel. Black and white raster images require only one bit of information per pixel.
Grayscale images require 8 bits per pixel. For photographic quality color, 24 bits of
RGB color information are required per pixel, yielding 256 levels of red, green, and
blue. For CMYK images, 32 bits per pixel are required.
When printing raster artwork, the quality of the output depends on the resolution of
the source raster. If the raster resolution is too low, individual pixels become visible in
the printed output as small squares. This effect is sometimes called “pixelation.”
In vector images, picture objects are defined mathematically as lines or curves between
points—hence the term “vector.” Picture elements can have solid, gradient, or
patterned color fills. Vector artwork is created in illustration and drawing applications
such as Illustrator and CorelDRAW. Page layout applications such as QuarkXPress also
allow you to create simple vector artwork with their drawing tools. PostScript fonts are
vector-based as well.
Vector artwork is resolution-independent; it can be scaled to any size and resolution
without danger of pixels becoming visible in printed output.
Summary of Contents for ColorPASS-Z5000
Page 1: ...ColorPASS Z5000 COLOR GUIDE I N C L U D E S F I E R Y S O F T W A R E ...
Page 2: ......
Page 6: ......
Page 96: ......
Page 148: ......
Page 160: ......
Page 172: ......
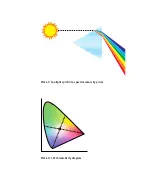
Page 175: ...Plate 1 Sunlight split into spectral colors by prism Plate 2 CIE chromaticity diagram ...
Page 179: ...Plate 5 Additive color model Plate 6 Color monitor ...
Page 180: ...Plate 7 Subtractive color model ...
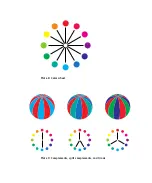
Page 185: ...Plate 8 Color wheel Plate 9 Complements split complements and triads ...
Page 198: ......
Page 206: ......
Page 208: ......

