19990401
5-10-1
Changing the Appearance of a Graph
5-10 Changing the Appearance of a Graph
k
k
k
k
k
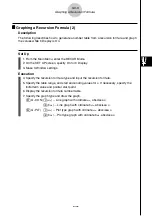
Drawing a Line
Description
The sketch function lets you draw points and lines inside of graphs.
Set Up
1. Draw the graph.
Execution
2. Select the sketch function you want to use.*
1
3
(SKTCH)
b
(Cls) ... Screen clear
c
(PLOT)
{On}/{Off}/{Change}/{Plot} ... Point {On}/{Off}/{Change}/{Plot}
d
(LINE)
{F-Line}/{Line} ... {Freehand line}/{Line}
e
(Text) ... Text input
f
(Pen) ... Freehand
g
(Tangnt) ... Tangent line
h
(Normal) ... Line normal to a curve
i
(Invrse) ... Inverse function*
2
j
(Circle) ... Circle
v
(Vert) ... Vertical line
l
(Horz) ... Horizontal line
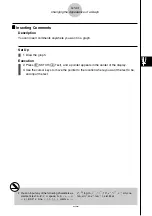
3. Use the cursor keys to move the pointer ( ) to the location where you want to draw,
and press
w
.*
3
*
1
The above shows the function menu that
appears in the GRPH
•
TBL Mode. Menu items
may differ somewhat in other modes.
*
2
In the case of an inverse function graph,
drawing starts immediately after you select
this option.
*
3
Some sketch functions require specification of
two points. After you press
w
to specify the
first point, use the cursor keys to move the
pointer to the location of the second point and
press
w
.

