19990401
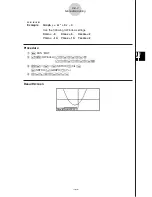
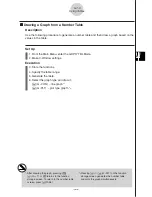
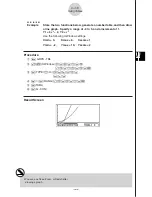
Example
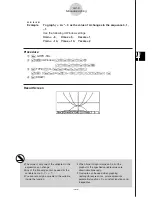
Store the two functions below, generate a number table, and then draw
a line graph. Specify a range of –3 to 3, and a increment of 1.
Y1 = 3
x
2
– 2, Y2 =
x
2
Use the following V-Window settings.
Xmin = 0,
Xmax = 6,
Xscale = 1
Ymin = –2,
Ymax = 10, Yscale = 2
Procedure
1
m
GRPH
•
TBL
2
!
K
(V-Window)
a
w
g
w
b
w
c
-
c
w
ba
w
c
w
i
3
3
(TYPE)
b
(Y=)
d
vx
-c
w
vxw
4
6
(
g
)
2
(RANG)
-
d
w
d
w
b
w
i
5
5
(TABL)
6
4
(G
•
CON)
Result Screen
5-7-10
Using Tables
# You can use Trace, Zoom, or Sketch after
drawing a graph.
Summary of Contents for ALGEBRA FX 2.0
Page 1: ... ALGEBRA FX 2 0 User s Guide ...
Page 19: ...19990401 ALGEBRA FX 2 0 ...
Page 26: ...19990401 1 1 Keys 1 1 1 Keys REPLAY COPY PASTE CAT CAL H COPY PRGM List Mat i ...
Page 122: ...19990401 ...
Page 280: ...19990401 ...
Page 310: ...19990401 ...
Page 358: ...19990401 8 8 2 Program Library egcw w ww w ...
Page 360: ...19990401 8 8 4 Program Library Example 1 Example 2 fw baw bf w fw baw ca w ...
Page 362: ...19990401 8 8 6 Program Library ...
Page 364: ...19990401 8 8 8 Program Library dw fcde wfcde wfcde fcde w daw w ...
Page 366: ...19990401 8 8 10 Program Library b awaw bwaw aw9d w ...
Page 423: ...19981001 MEMO ...
Page 424: ...19981001 MEMO ...
Page 425: ...19981001 MEMO ...

