19990401
5-7-16
Using Tables
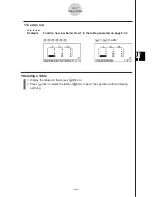
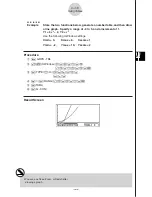
Example
Store the function Y1 = 3log
x
and simultaneously display its number
table and plot-type graph. Use a table range of 2 through 9, with an
increment of 1.
Use the following V-Window settings.
Xmin = –1,
Xmax = 10, Xscale = 1
Ymin = –1,
Ymax = 4,
Yscale = 1
Procedure
1
m
GRPH
•
TBL
2
!
K
(V-Window)
-
b
w
ba
w
b
w
c
-
b
w
e
w
b
w
i
u
3
(SET UP)
ccc
1
(T+G)
i
3
3
(TYPE)
b
(Y=)
d
lvw
6
(
g
)
2
(RANG)
c
w
j
w
b
w
i
4
5
(TABL)
5
(G
•
PLT)
5
6
(
g
)
4
(G
•
Link)
6
c
~
c
,
f
~
f
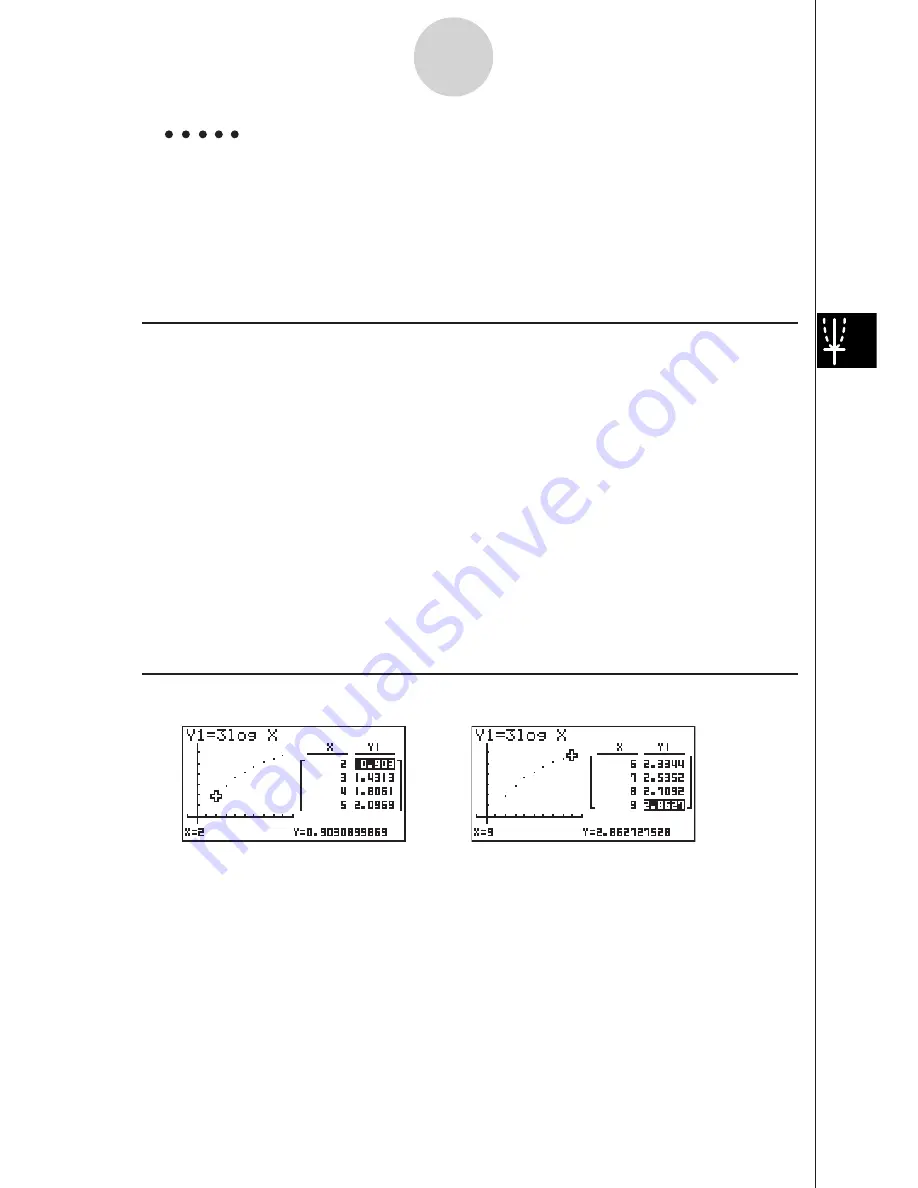
Result Screen
…
$
%
…
Summary of Contents for ALGEBRA FX 2.0
Page 1: ... ALGEBRA FX 2 0 User s Guide ...
Page 19: ...19990401 ALGEBRA FX 2 0 ...
Page 26: ...19990401 1 1 Keys 1 1 1 Keys REPLAY COPY PASTE CAT CAL H COPY PRGM List Mat i ...
Page 122: ...19990401 ...
Page 280: ...19990401 ...
Page 310: ...19990401 ...
Page 358: ...19990401 8 8 2 Program Library egcw w ww w ...
Page 360: ...19990401 8 8 4 Program Library Example 1 Example 2 fw baw bf w fw baw ca w ...
Page 362: ...19990401 8 8 6 Program Library ...
Page 364: ...19990401 8 8 8 Program Library dw fcde wfcde wfcde fcde w daw w ...
Page 366: ...19990401 8 8 10 Program Library b awaw bwaw aw9d w ...
Page 423: ...19981001 MEMO ...
Page 424: ...19981001 MEMO ...
Page 425: ...19981001 MEMO ...

