19990401
k
Changing Graph Parameters
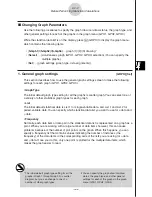
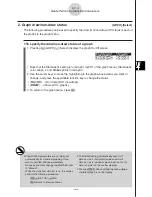
Use the following procedures to specify the graph draw/non-draw status, the graph type, and
other general settings for each of the graphs in the graph menu (GPH1, GPH2, GPH3).
While the statistical data list is on the display, press
1
(GRPH) to display the graph menu,
which contains the following items.
• {
S-Gph1
}
/
{
S-Gph2
}
/
{
S-Gph3
} ... graph {1}/{2}/{3} drawing
*1
• {
Select
} ... {simultaneous graph (GPH1, GPH2, GPH3) selection} (You can specify the
multiple graphs.)
• {
Set
} ... {graph settings (graph type, list assignments)}
1. General graph settings
[GRPH]
-
[Set]
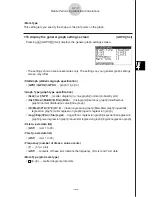
This section describes how to use the general graph settings screen to make the following
settings for each graph (GPH1, GPH2, GPH3).
• Graph Type
The initial default graph type setting for all the graphs is scatter graph. You can select one of
a variety of other statistical graph types for each graph.
• List
The initial default statistical data is List 1 for single-variable data, and List 1 and List 2 for
paired-variable data. You can specify which statistical data list you want to use for
x
-data and
y
-data.
• Frequency
Normally, each data item or data pair in the statistical data list is represented on a graph as a
point. When you are working with a large number of data items however, this can cause
problems because of the number of plot points on the graph. When this happens, you can
specify a frequency list that contains values indicating the number of instances (the
frequency) of the data items in the corresponding cells of the lists you are using for
x
-data
and
y
-data. Once you do this, only one point is plotted for the multiple data items, which
makes the graph easier to read.
6-1-2
Before Performing Statistical Calculations
*1
The initial default graph type setting for all the
graphs (Graph 1 through Graph 3) is scatter
diagram, but you can change to one of a
number of other graph types.
# You can specify the graph draw/non-draw
status, the graph type, and other general
settings for each of the graphs in the graph
menu (GPH1, GPH2, GPH3).
Summary of Contents for ALGEBRA FX 2.0
Page 1: ... ALGEBRA FX 2 0 User s Guide ...
Page 19: ...19990401 ALGEBRA FX 2 0 ...
Page 26: ...19990401 1 1 Keys 1 1 1 Keys REPLAY COPY PASTE CAT CAL H COPY PRGM List Mat i ...
Page 122: ...19990401 ...
Page 280: ...19990401 ...
Page 310: ...19990401 ...
Page 358: ...19990401 8 8 2 Program Library egcw w ww w ...
Page 360: ...19990401 8 8 4 Program Library Example 1 Example 2 fw baw bf w fw baw ca w ...
Page 362: ...19990401 8 8 6 Program Library ...
Page 364: ...19990401 8 8 8 Program Library dw fcde wfcde wfcde fcde w daw w ...
Page 366: ...19990401 8 8 10 Program Library b awaw bwaw aw9d w ...
Page 423: ...19981001 MEMO ...
Page 424: ...19981001 MEMO ...
Page 425: ...19981001 MEMO ...


