19990401
k
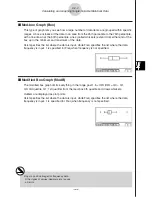
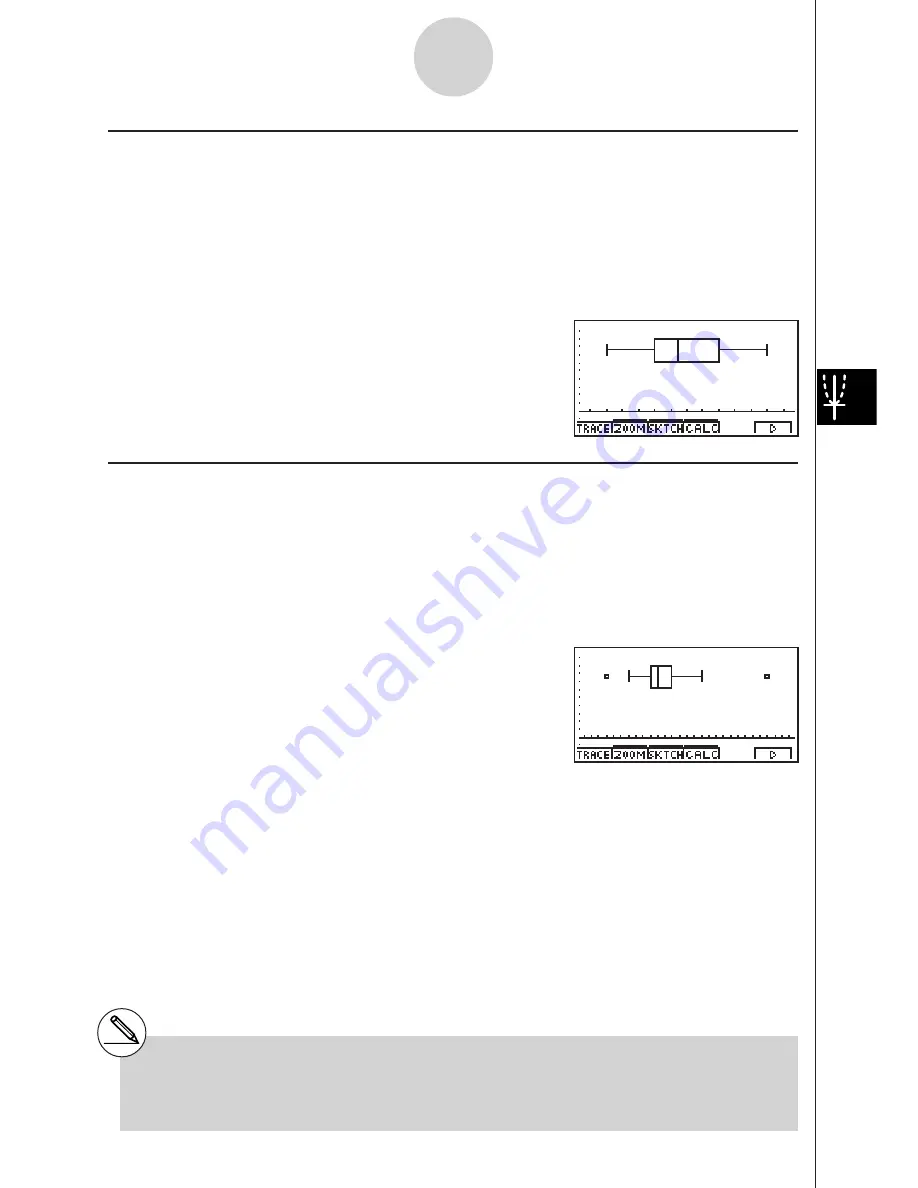
Med-box Graph (Box)
This type of graph lets you see how a large number of data items are grouped within specific
ranges. A box encloses all the data in an area from the 25th percentile to the 75th percentile,
with a line drawn at the 50th percentile. Lines (called whiskers) extend from either end of the
box up to the minimum and maximum of the data.
XList specifies the list where the data is input, while Freq specifies the list where the data
frequency is input. 1 is specified for Freq when frequency is not specified.
k
Modified Box Graph (ModB)
The modified box graph omits everything in the range past 1.5
!
IQR (IQR = Q3 – Q1,
Q3: 3rd quartile, Q1: 1st quartile) from the med-box 4th quartile and draws whiskers.
Outliers are displayed as plot points.
XList specifies the list where the data is input, while Freq specifies the list where the data
frequency is input. 1 is specified for Freq when frequency is not specified.
6-2-2
Calculating and Graphing Single-Variable Statistical Data
# Input a positive integer for frequency data.
Other types of values (decimals, etc.) cause
an error.
Summary of Contents for ALGEBRA FX 2.0
Page 1: ... ALGEBRA FX 2 0 User s Guide ...
Page 19: ...19990401 ALGEBRA FX 2 0 ...
Page 26: ...19990401 1 1 Keys 1 1 1 Keys REPLAY COPY PASTE CAT CAL H COPY PRGM List Mat i ...
Page 122: ...19990401 ...
Page 280: ...19990401 ...
Page 310: ...19990401 ...
Page 358: ...19990401 8 8 2 Program Library egcw w ww w ...
Page 360: ...19990401 8 8 4 Program Library Example 1 Example 2 fw baw bf w fw baw ca w ...
Page 362: ...19990401 8 8 6 Program Library ...
Page 364: ...19990401 8 8 8 Program Library dw fcde wfcde wfcde fcde w daw w ...
Page 366: ...19990401 8 8 10 Program Library b awaw bwaw aw9d w ...
Page 423: ...19981001 MEMO ...
Page 424: ...19981001 MEMO ...
Page 425: ...19981001 MEMO ...


