251
18-2
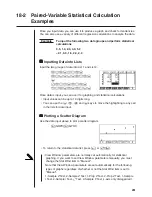
Paired-Variable Statistical Calculation
Examples
Once you input data, you can use it to produce a graph and check for tendencies.
You can also use a variety of different regression calculations to analyze the data.
Example
To input the following two data groups and perform statistical
calculations
0.5, 1.2, 2.4, 4.0, 5.2
–2.1, 0.3, 1.5, 2.0, 2.4
k
k
k
k
k
Inputting Data into Lists
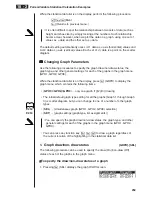
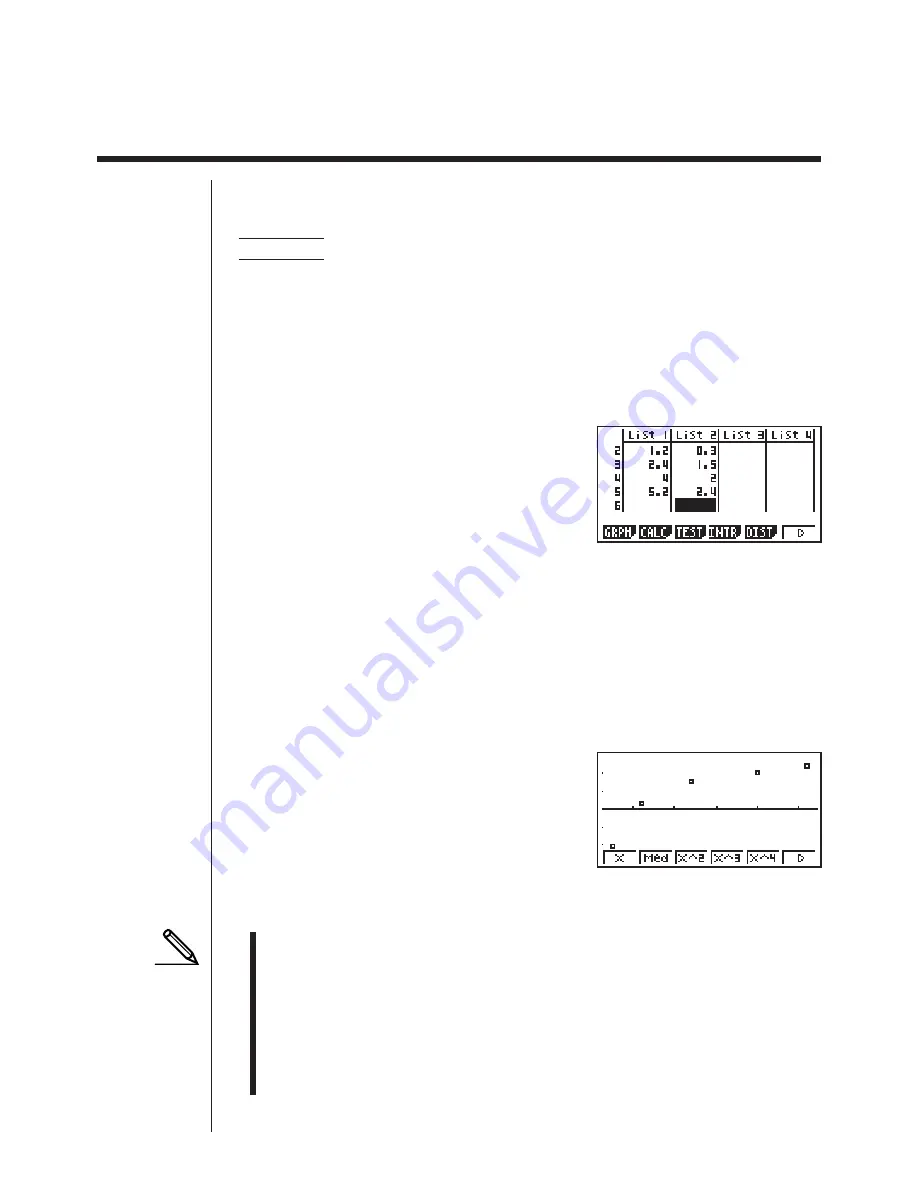
Input the two groups of data into List 1 and List 2.
a.f
w
b.c
w
c.e
w
e
w
f.c
w
e
-
c.b
w
a.d
w
b.f
w
c
w
c.e
w
Once data is input, you can use it for graphing and statistical calculations.
• Input values can be up to 10 digits long.
• You can use the
f
,
c
,
d
and
e
keys to move the highlighting to any cell
in the lists for data input.
k
k
k
k
k
Plotting a Scatter Diagram
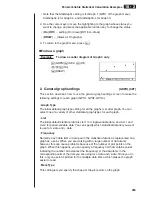
Use the data input above to plot a scatter diagram.
1
(GRPH)
1
(GPH1)
• To return to the statistical data list, press
J
or
!Q
.
• View Window parameters are normally set automatically for statistical
graphing. If you want to set View Window parameters manually, you must
change the Stat Wind item to “Manual”.
Note that View Window parameters are set automatically for the following
types of graphs regardless of whether or not the Stat Wind item is set to
“Manual”.
1-Sample
Z
Test, 2-Sample
Z
Test, 1-Prop
Z
Test, 2-Prop
Z
Test, 1-Sample
t
Test, 2-Sample
t
Test,
!
2
Test, 2-Sample
F
Test (
x
-axis only disregarded).
Summary of Contents for CFX-9970G
Page 22: ... CFX 9970G ...
Page 452: ...435 1 2 3 4 5 Program for Circle and Tangents No 4 Step Key Operation Display ...
Page 453: ...436 Program for Circle and Tangents No 4 Step Key Operation Display 6 7 8 9 10 ...
Page 454: ...437 11 12 13 14 15 Program for Circle and Tangents No 4 Step Key Operation Display ...
Page 455: ...438 16 17 18 Program for Circle and Tangents No 4 Step Key Operation Display ...
Page 458: ...441 1 2 3 4 5 Program for Rotating a Figure No 5 Step Key Operation Display ...

