263
Calculating and Graphing Paired-Variable Statistical Data
18 - 4
k
k
k
k
k
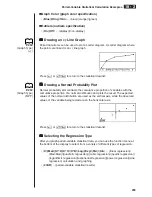
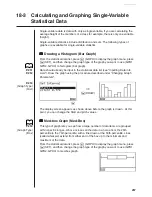
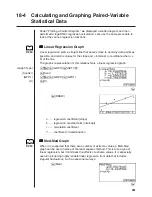
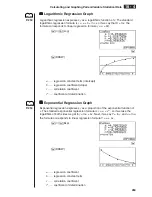
Logarithmic Regression Graph
P.254
Logarithmic regression expresses
y
as a logarithmic function of
x
. The standard
logarithmic regression formula is
y
=
a
+
b
"
In
x
, so if we say that X = In
x
, the
formula corresponds to linear regression formula
y
=
a
+
b
X.
6
(
g
)
1
(Log)
1 2 3 4 5
6
6
(DRAW)
a ......
regression constant term (intercept)
b ......
regression coefficient (slope)
r ......
correlation coefficient
r
2
..... coefficient of determination
k
k
k
k
k
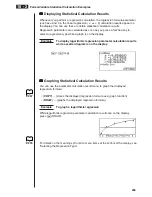
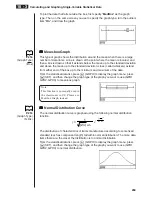
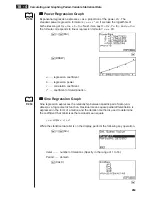
Exponential Regression Graph
P.254
Exponential regression expresses
y
as a proportion of the exponential function of
x
. The standard exponential regression formula is
y
=
a
"
e
bx
, so if we take the
logarithms of both sides we get In
y
= In
a
+
bx
. Next, if we say Y = In
y
, and
a
= In
a
,
the formula corresponds to linear regression formula Y =
a
+
bx
.
6
(
g
)
2
(Exp)
1 2 3 4 5
6
6
(DRAW)
a ......
regression coefficient
b ......
regression constant term
r ......
correlation coefficient
r
2
..... coefficient of determination
Summary of Contents for CFX-9970G
Page 22: ... CFX 9970G ...
Page 452: ...435 1 2 3 4 5 Program for Circle and Tangents No 4 Step Key Operation Display ...
Page 453: ...436 Program for Circle and Tangents No 4 Step Key Operation Display 6 7 8 9 10 ...
Page 454: ...437 11 12 13 14 15 Program for Circle and Tangents No 4 Step Key Operation Display ...
Page 455: ...438 16 17 18 Program for Circle and Tangents No 4 Step Key Operation Display ...
Page 458: ...441 1 2 3 4 5 Program for Rotating a Figure No 5 Step Key Operation Display ...


