303
18-8
Distribution
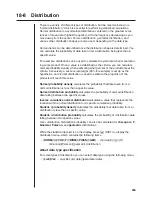
There is a variety of different types of distribution, but the most well-known is
“normal distribution,” which is essential for performing statistical calculations.
Normal distribution is a symmetrical distribution centered on the greatest occur-
rences of mean data (highest frequency), with the frequency decreasing as you
move away from the center. Poisson distribution, geometric distribution, and
various other distribution shapes are also used, depending on the data type.
Certain trends can be determined once the distribution shape is determined. You
can calculate the probability of data taken from a distribution being less than a
specific value.
For example, distribution can be used to calculate the yield rate when manufactur-
ing some product. Once a value is established as the criteria, you can calculate
normal probability density when estimating what percent of the products meet the
criteria. Conversely, a success rate target (80% for example) is set up as the
hypothesis, and normal distribution is used to estimate the proportion of the
products will reach this value.
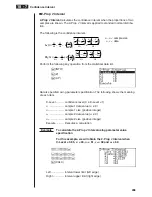
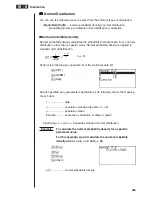
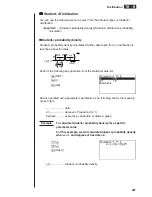
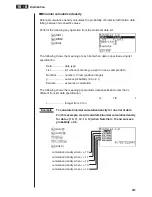
Normal probability density
calculates the probability that data taken from a
normal distribution is less than a specific value.
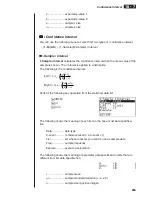
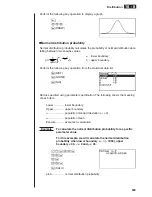
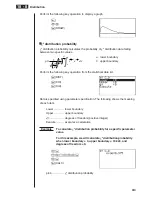
Normal distribution probability
calculates the probability of normal distribution
data falling between two specific values.
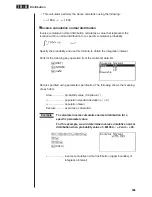
Inverse cumulative normal distribution
calculates a value that represents the
location within a normal distribution for a specific cumulative probability.
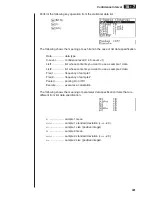
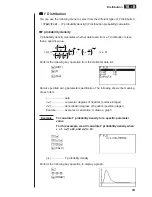
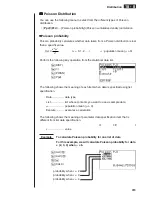
Student-
t
probability density
calculates the probability that data taken from a
t
distribution is less than a specific value.
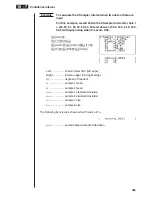
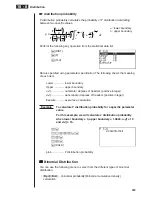
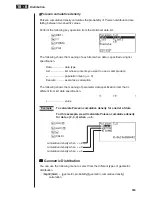
Student-
t
distribution probability
calculates the probability of
t
distribution data
falling between two specific values.
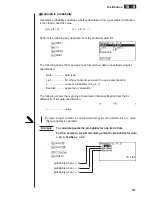
Like
t
distribution, distribution probability can also be calculated for
chi-square
,
F
,
binomial
,
Poisson
, and
geometric
distributions.
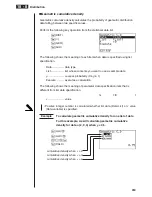
While the statistical data list is on the display, press
5
(DIST) to display the
distribution menu, which contains the following items.
• {
NORM
}
/
{
t
}
/
{
CHI
}
/
{
F
}
/
{
BINM
}
/
{
POISN
}
/
{
GEO
} ... {normal}/{
t
}/{
!
2
}/{
F
}/
{binomial}/{Poisson}/{geometric} distribution
About data type specification
For some types of distribution you can select data type using the following menu.
• {
List
}
/
{
Var
} ... specifies {list data}/{parameter data}
Summary of Contents for CFX-9970G
Page 22: ... CFX 9970G ...
Page 452: ...435 1 2 3 4 5 Program for Circle and Tangents No 4 Step Key Operation Display ...
Page 453: ...436 Program for Circle and Tangents No 4 Step Key Operation Display 6 7 8 9 10 ...
Page 454: ...437 11 12 13 14 15 Program for Circle and Tangents No 4 Step Key Operation Display ...
Page 455: ...438 16 17 18 Program for Circle and Tangents No 4 Step Key Operation Display ...
Page 458: ...441 1 2 3 4 5 Program for Rotating a Figure No 5 Step Key Operation Display ...

