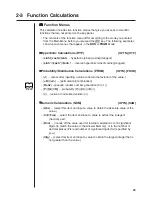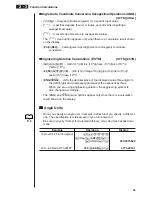
29
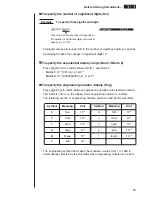
• {
x
*
n
}
/
{
y
*
n
} ... population standard deviation of {
x
-data}/{
y
-data}
• {
x
*
n
-1
}
/
{
y
*
n
-1
} ... sample standard deviation of {
x
-data}/{
y
-data}
• {
minX
}
/
{
minY
} ... minimum value of {
x
-data}/{
y
-data}
• {
maxX
}
/
{
maxY
} ... maximum value of {
x
-data}/{
y
-data}
u
u
u
u
u
{
GRPH
}
...{graph data menu}
The following are the items that appear in the above menu.
• {
a
}
/
{
b
}
/
{
c
}
/
{
d
}
/
{
e
} ... {regression coefficient and multinomial coefficients}
• {
r
} ... {correlation coefficient}
• {
Q1
}
/
{
Q3
} ... {first quartile}/{third quartile}
• {
Med
}
/
{
Mod
} ... {median}/{mode} of input data
• {
Strt
}
/
{
Pitch
} ... histogram {start division}/{pitch}
• {
Iter
}
/
{
Perid
} ... sine regression {number of iterations}/{period}
u
u
u
u
u
{
PTS
}
... {summary point data menu}
The following are the items that appear in the above menu.
• {
x
1
}
/
{
y
1
}
/
{
x
2
}
/
{
y
2
}
/
{
x
3
}
/
{
y
3
} ... {coordinates of summary points}
u
u
u
u
u
{
TEST
}
... {test data recall}
The following are the items that appear in the above menu.
• {
n
}
/
{
ooooo
}
/
{
x
*
n
-1
} ... {number of data}/{data mean}/{sample standard deviation}
• {
n
1
}
/
{
n
2
} ... number of {data 1}/{data 2}
• {
ooooo
1
}
/
{
ooooo
2
} ... mean of {data 1}/{data 2}
• {
x
1
*
}
/
{
x
2
*
} ... sample standard deviation of {data 1}/{data 2}
• {
x
p
*
} ... {pooled sample standard deviation}
• {
F
} ... {
F
value}
• {
Fdf
}
/
{
SS
}
/
{
MS
} ... factor {degrees of freedom}/{sum of squares}/{mean of
squares}
• {
Edf
}
/
{
SSe
}
/
{
MSe
} ... error {degrees of freedom}/{sum of squares}/{mean of
squares}
u
{
RESLT
}
...
{test result recall}
The following are the items that appear in the above menu.
• {
p
} ... {p value}
• {
z
}
/
{
t
}
/
{
Chi
}
/
{
F
} ... {
Z
test results}/{
t
test results}/{
+
2
test results}/{
F
test
results}
• {
Left
}
/
{
Right
} ... {interval lower limit (left edge)}/{interval upper limit (right
edge)}
• {
ˆp
}
/
{
ˆp
1
}
/
{
ˆp
2
} ... {expected probability value}/{expected probability value 1}/
{expected probability value 2}
• {
df
}
/
{
s
}
/
{
r
}
/
{
r
2
} ... {degrees of freedom}/{standard error}/{correlation
coefficient}/{coefficient of determination}
Variable Data (VARS) Menu
1 - 4
Summary of Contents for CFX-9970G
Page 22: ... CFX 9970G ...
Page 452: ...435 1 2 3 4 5 Program for Circle and Tangents No 4 Step Key Operation Display ...
Page 453: ...436 Program for Circle and Tangents No 4 Step Key Operation Display 6 7 8 9 10 ...
Page 454: ...437 11 12 13 14 15 Program for Circle and Tangents No 4 Step Key Operation Display ...
Page 455: ...438 16 17 18 Program for Circle and Tangents No 4 Step Key Operation Display ...
Page 458: ...441 1 2 3 4 5 Program for Rotating a Figure No 5 Step Key Operation Display ...

