20050501
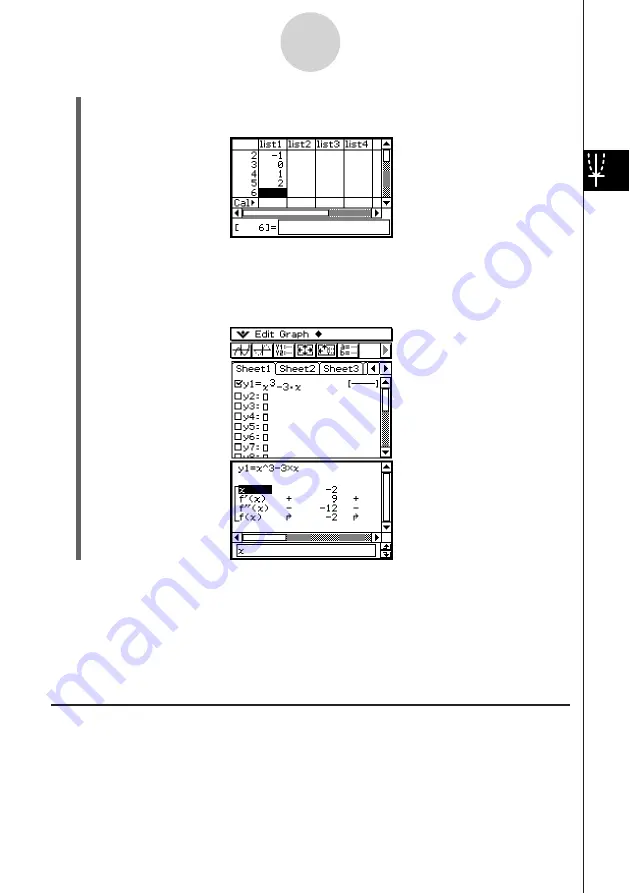
(5) Tap the Graph Editor window to make it active.
(6) Tap
4
.
• This starts summary table generation using the
x
-values you input in step (4), and
displays the result on the Table window.
3-4-15
Using Table & Graph
Important!
• For the above method to correctly generate a summary table, you must have legal
x
-values
in the list assigned to the LIST variable. Note that an error occurs if the specified LIST
variable is empty or does not exist.
• Some functions may not be solvable by the ClassPad’s internal summary table calculation.
When this happens, the “Can’t Solve!” error message appears on the display.
Making the Graph Editor Window the Active Window
While the Table window is active, you can make the Graph Editor window the active window
by tapping anywhere inside of it or by tapping
!
.
(4) Input the values you want to specify for
x
into list1.
• Here, we will input the following values:
x
= –2, –1, 0, 1, 2.
Summary of Contents for ClassPad 300 PLUS
Page 11: ...20050501 ClassPad 300 PLUS ClassPad OS Version 2 20 ...
Page 197: ...20050501 2 10 7 Using Verify 4 Input x 2 1 and press E 5 Input x i x i and press E ...
Page 649: ...20050501 u Graph Line Clustered D u Graph Line Stacked F 13 8 2 Graphing ...
Page 650: ...20050501 u Graph Line 100 Stacked G u Graph Column Clustered H 13 8 3 Graphing ...
Page 651: ...20050501 u Graph Column Stacked J u Graph Column 100 Stacked K 13 8 4 Graphing ...
Page 652: ...20050501 u Graph Bar Clustered L u Graph Bar Stacked 13 8 5 Graphing ...


