20090601
S
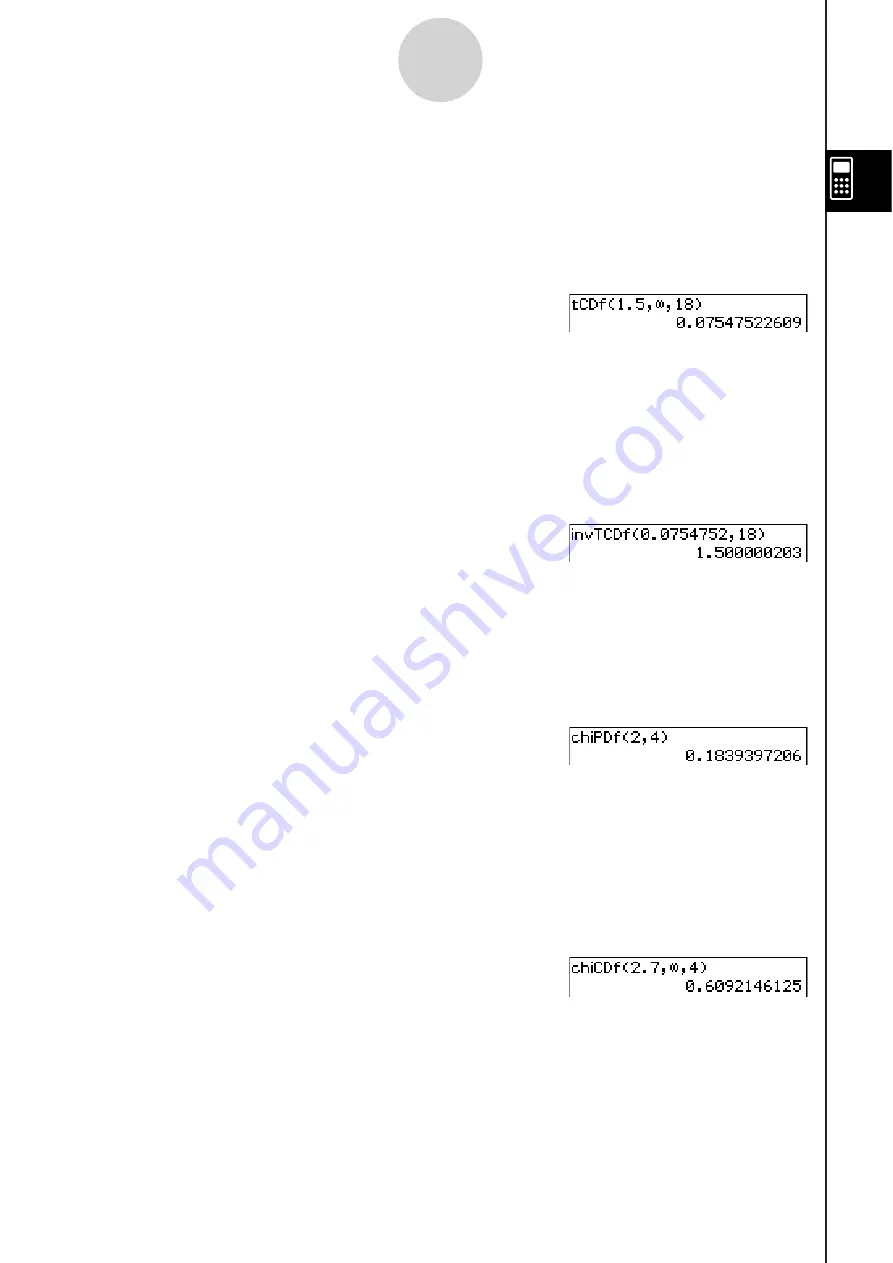
tCDf
Function: Returns the cumulative probability of a Student-
t
distribution between a lower
bound and an upper bound.
Syntax: tCDf(lower value, upper value,
df
[ ) ]
Example: To determine the Student-
t
distribution probability when lower value = 1.5,
upper value =
d
,
df
= 18
Menu Item: [Action][Distribution][tCDf]
For more information, see “Student-
t
Cumulative Distribution” on page 7-11-7.
S
invTCDf
Function: Returns the lower bound value of a Student-
t
cumulative distribution probability
for specified values.
Syntax: invTCDf(
prob
,
df
[ ) ]
Example: To determine the lower bound value when
prob
= 0.0754752,
df
= 18
Menu Item: [Action][Inv. Distribution][invTCDf]
For more information, see “Inverse Student-
t
Cumulative Distribution” on page 7-11-8.
S
chiPDf
Function: Returns the
C
2
probability density for specified values.
Syntax: chiPDf(
x
,
df
[ ) ]
Example: To determine the
C
2
probability density when
x
= 2,
df
= 4
Menu Item: [Action][Distribution][chiPDf]
For more information, see “
χ
2
Probability Density” on page 7-11-9.
S
chiCDf
Function: Returns the cumulative probability of a
C
2
distribution between a lower bound
and an upper bound.
Syntax: chiCDf(lower value, upper value,
df
[ ) ]
Example: To determine the
C
2
probability when lower value = 2.7, upper value =
d
,
df
=4
Menu Item: [Action][Distribution][chiCDf]
For more information, see “
C
2
Cumulative Distribution” on page 7-11-10.
S
invChiCDf
Function: Returns the lower bound value of a
C
2
cumulative distribution probability for
specified
values.
Syntax: invChiCDf(
prob
,
df
[ ) ]
Example: To determine the lower bound value when
prob
= 0.6092146,
df
= 4
2-8-51
Using the Action Menu
Summary of Contents for ClassPad 330
Page 11: ...20060301 20090601 ClassPad 330 ClassPad OS Version 3 04 ...
Page 277: ...20060301 3 3 10 Storing Functions 3 Tap AND Plot OR Plot ...
Page 779: ...20090601 S Graph Line Clustered C S Graph Line Stacked E 13 9 2 Graphing ...
Page 780: ...20090601 S Graph Line 100 Stacked F S Graph Column Clustered G 13 9 3 Graphing ...
Page 781: ...20090601 S Graph Column Stacked I S Graph Column 100 Stacked J 13 9 4 Graphing ...
Page 782: ...20090601 S Graph Bar Clustered K S Graph Bar Stacked 9 13 9 5 Graphing ...


