20060301
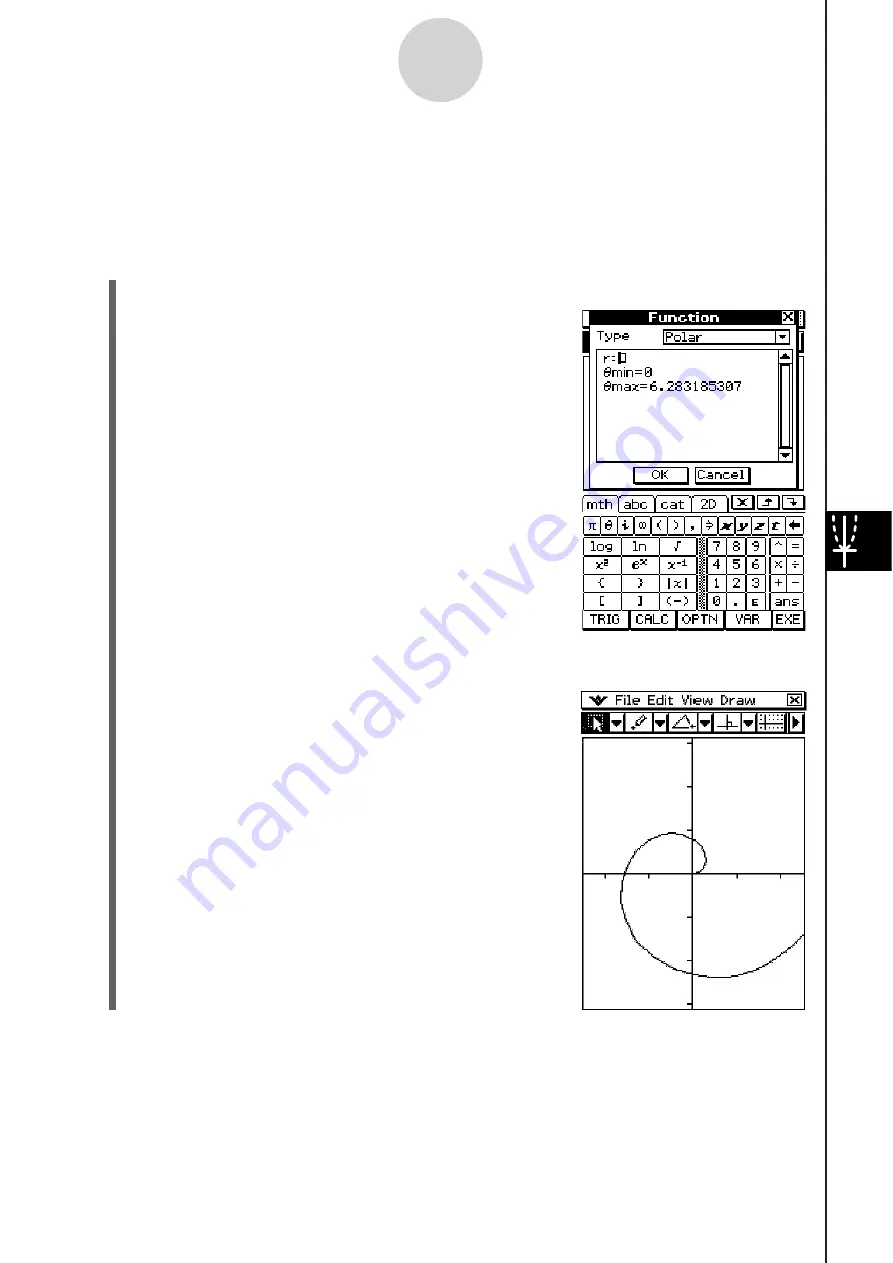
(1) Tap [Draw], [Function], and then [Polar].
• This displays the Function dialog box and a soft
keyboard as shown here.
8-2-8
Drawing Figures
S
To draw a polar equation graph
Note
In this example the [Function Angle] setting of the Geometry Format dialog box is set to
“Radian”. See page 1-9-10 for more information.
(2) Input the equation “
r
=
θ
” here and then tap [OK].
• This displays a polar equation graph as shown here.
20080201
Summary of Contents for ClassPad 330
Page 11: ...20060301 20090601 ClassPad 330 ClassPad OS Version 3 04 ...
Page 277: ...20060301 3 3 10 Storing Functions 3 Tap AND Plot OR Plot ...
Page 779: ...20090601 S Graph Line Clustered C S Graph Line Stacked E 13 9 2 Graphing ...
Page 780: ...20090601 S Graph Line 100 Stacked F S Graph Column Clustered G 13 9 3 Graphing ...
Page 781: ...20090601 S Graph Column Stacked I S Graph Column 100 Stacked J 13 9 4 Graphing ...
Page 782: ...20090601 S Graph Bar Clustered K S Graph Bar Stacked 9 13 9 5 Graphing ...


