20090601
13-4-16
Editing Cell Contents
S
To drag and drop within the edit box
(1) Select the cell whose contents you want to edit.
(2) Tap the edit box to enter the edit mode.
(3) Tap the edit box again to display the editing cursor (a solid blinking cursor).
(4) Drag the stylus across the characters you want to move, so they are highlighted.
(5) Holding the stylus against the selected characters, drag to the desired location.
(6) Lift the stylus to drop the characters in place.
U
s
ing Drag and Drop to Obtain Spread
s
heet Graph Data
The following examples show how you can drag graph data from a Spreadsheet application
Graph window to obtain the graph’s function or the values of the graph’s data.
S
To u
s
e drag and drop to obtain the function of a graph
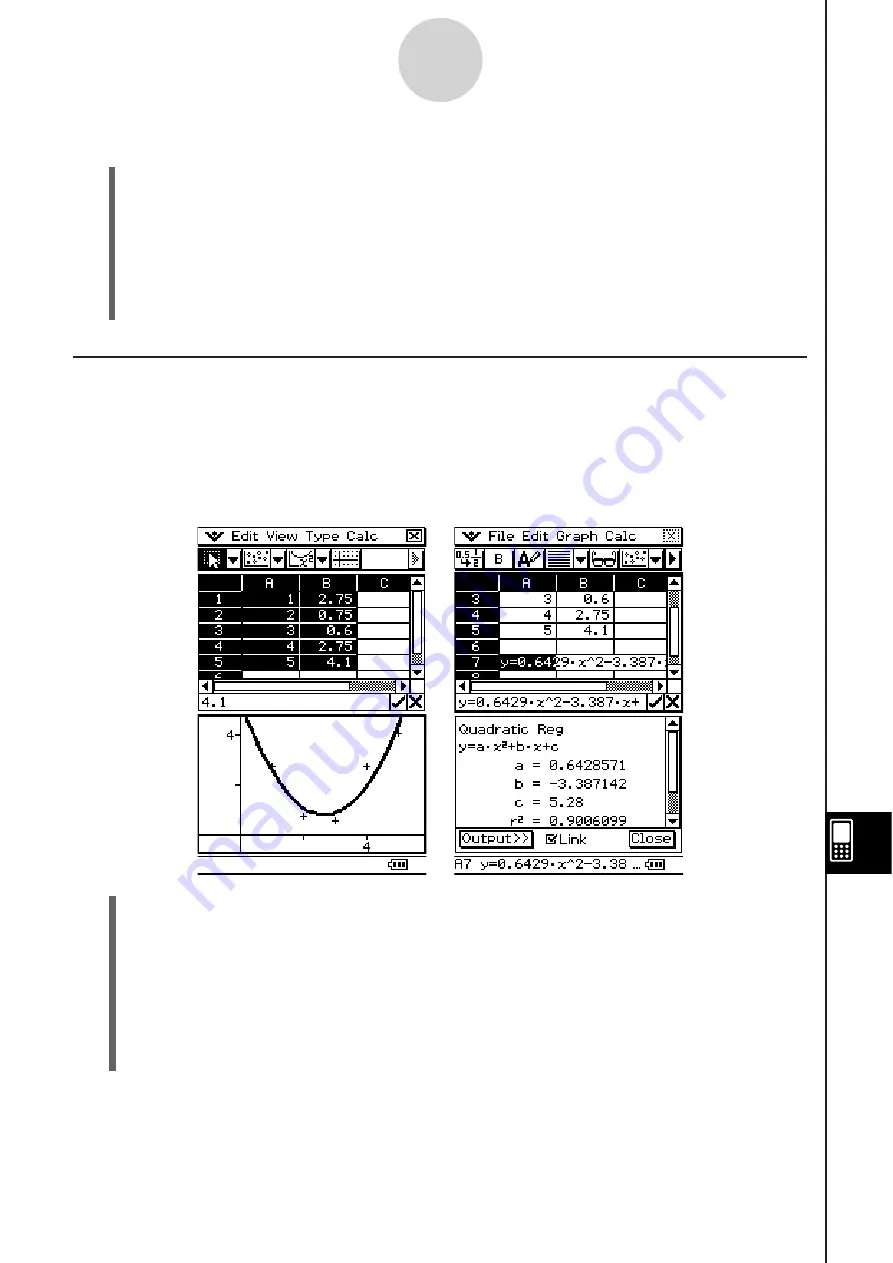
Example:
To obtain the function of the regression graph shown below
(1) Input data and plot the scatter graph.
(2)
On the [Calc] menu, clear the check box next to [DispStat] by tapping it.
(3)
Draw a regression curve. For example, tap [Calc] and then [Quadratic Reg] here.
• See “Regression Graph Operations” on page 13-9-15 for more information on drawing
regression graph.
(4) Tap the graph curve and then drag to the cell you want in the Spreadsheet window.
• This will cause the graph’s function to appear inside the cell.
Summary of Contents for ClassPad 330
Page 11: ...20060301 20090601 ClassPad 330 ClassPad OS Version 3 04 ...
Page 277: ...20060301 3 3 10 Storing Functions 3 Tap AND Plot OR Plot ...
Page 779: ...20090601 S Graph Line Clustered C S Graph Line Stacked E 13 9 2 Graphing ...
Page 780: ...20090601 S Graph Line 100 Stacked F S Graph Column Clustered G 13 9 3 Graphing ...
Page 781: ...20090601 S Graph Column Stacked I S Graph Column 100 Stacked J 13 9 4 Graphing ...
Page 782: ...20090601 S Graph Bar Clustered K S Graph Bar Stacked 9 13 9 5 Graphing ...


