20060301
2-10-5
Using the Main Application in Combination with Other Applications
(4) Press
to register the expression.
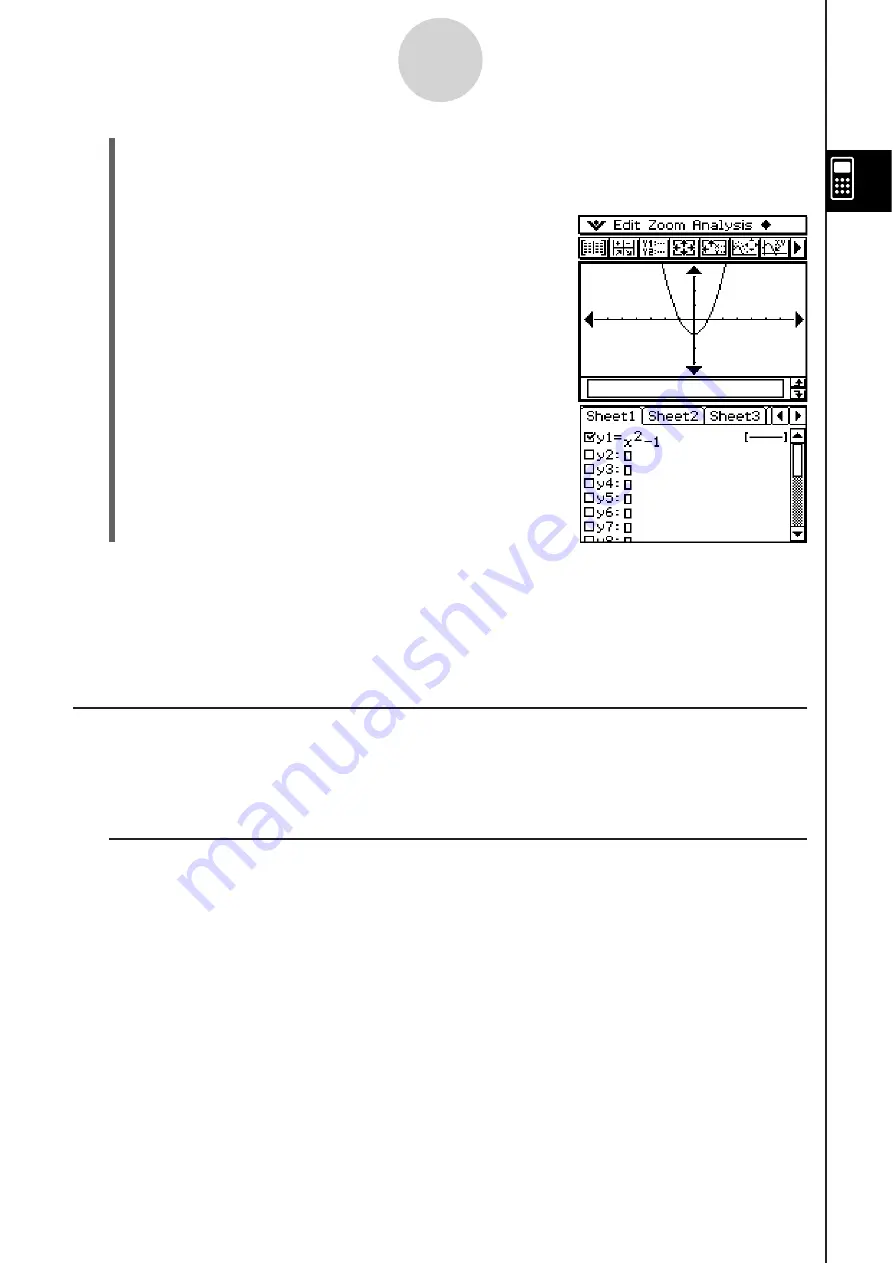
• The copied expression is displayed in natural format, with the check box
next to it selected.
•
You could now tap
to graph the function.
Tip
• For more information about the Graph Editor window, see Chapter 3. For more information about
the Conics Graph Editor window, see Chapter 4. For more information about the 3D Graph Editor
window, see Chapter 5. For more information about the Numeric Solver window, see Chapter 9.
U
s
ing the Stat Editor Window
You can use the Stat Editor window to create new LIST variables and edit existing LIST
variables. You can also use the Stat Editor window to display the contents of a LIST variable
created using the work area by specifying the LIST variable’s name.
I
Example Li
s
t Operation
The following are the general steps for using the Stat Editor. The steps indicated in
parentheses refer to the steps under “ClassPad Operation” below.
1. Display the Stat Editor (step (1)) and input data for two LIST variables named “list1” and
“list2” (step (2)).
2. On the work area window, perform calculations that use “list1” and “list2” (steps (3) and (4)).
3. Use the work area to assign numbers to a variable and create a new LIST variable (steps (5)
and (6)).
4. Display the Stat Editor window and recall the LIST variable you created (steps (7), (8) and
(9)).
Summary of Contents for ClassPad 330
Page 11: ...20060301 20090601 ClassPad 330 ClassPad OS Version 3 04 ...
Page 277: ...20060301 3 3 10 Storing Functions 3 Tap AND Plot OR Plot ...
Page 779: ...20090601 S Graph Line Clustered C S Graph Line Stacked E 13 9 2 Graphing ...
Page 780: ...20090601 S Graph Line 100 Stacked F S Graph Column Clustered G 13 9 3 Graphing ...
Page 781: ...20090601 S Graph Column Stacked I S Graph Column 100 Stacked J 13 9 4 Graphing ...
Page 782: ...20090601 S Graph Bar Clustered K S Graph Bar Stacked 9 13 9 5 Graphing ...


