20021201
7-11-1
Distribution
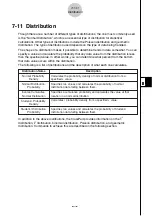
7-11 Distribution
Though there are a number of different types of distributions, the one most commonly used
is the “Normal Distribution”, which is an essential type of distribution for statistical
calculations. Other types of distributions include the Poisson distribution and geometric
distribution. The type of distribution used depends on the type of data being handled.
The shape of a distribution makes it possible to determine trends in data somewhat. You can
specify a value and calculate the probability that any data value from the distribution is less
than the specified value. In other words, you can determine what percent from the bottom
that data value occurs within the distribution.
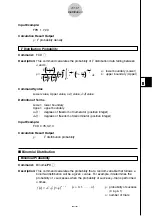
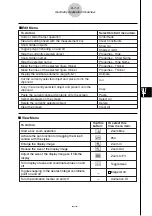
The following is a list of distributions and the description of what each one calculates.
Normal Probability
Density
Description
Distribution Name
Calculates the probability density of normal distribution from a
specified
x
value.
Normal Distribution
Probability
Specifies two values and calculates the probability of normal
distribution data falling between them.
Inverse Cumulative
Normal Distribution
Specifies a cumulative probability and calculates the value at that
location in a normal distribution.
Student-
t
Probability
Density
Calculates
t
probability density from a specified
x
value.
Student-
t
Distribution
Probability
Specifies two values and calculates the probability of Student-
t
distribution data falling between them.
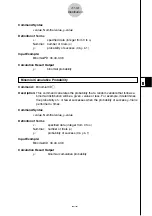
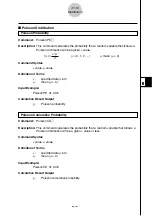
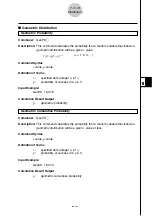
In addition to the above distributions, the ClassPad provides information on the
χ
2
distribution,
F
distribution, binomial distribution, Poisson distribution, and geometric
distribution. Commands to achieve this are described in the following section.

