E-51
A
Entering the CASH Mode
• Press
C
to enter the CASH Mode.
Value Input Screen
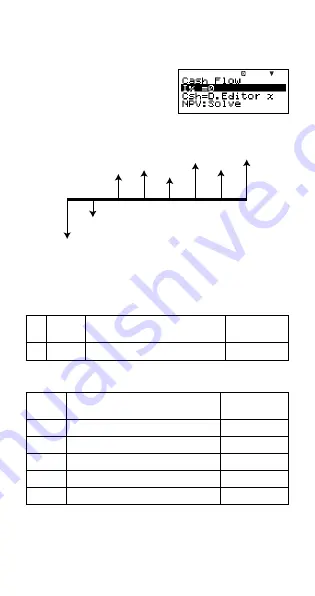
A cash flow diagram like the one shown below helps to
visualize the movement of funds.
With this graph, the initial investment amount is represented
by CF
0
. The cash flow one year later is shown by CF
1
, two
years later by CF
2
, and so on.
A
Setting Values
No. Display
Name
Values Used
in Examples
1
I
Annual Interest
3%
A
Receipt and Payment Summary
Period
Receipt/Payment
Values Used
in Examples
CF
0
Payment
–$10,000
CF
1
Payment
–$1,000
CF
2
Receipt
$4,500
CF
3
Receipt
$5,000
CF
4
Receipt
$4,000
• Input money paid out as a negative value, using the
y
key to input the minus sign.
CF
0
CF
1
CF
2
CF
3
CF
4
CF
5
CF
6
CF
7


