E-17
Inputting Data
Use the Stat Editor to input data. Perform the following key operation to
display the Stat Editor:
1
1
(STAT)
2
(Data).
The Stat Editor provides 80 rows for data input when there is an X column
only, 40 rows when there are X and FREQ columns or X and Y columns, or
26 rows when there are X, Y, and FREQ columns.
Note:
Use the FREQ (frequency) column to input the quantity (frequency) of
identical data items. Display of the FREQ column can be turned on (displayed)
or off (not displayed) using the Stat Format setting on the setup menu.
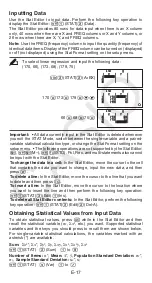
To select linear regression and input the following data:
(170, 66), (173, 68), (179, 75)
N
2
(STAT)
2
(A+BX)
170
=
173
=
179
=
ce
66
=
68
=
75
=
Important:
• All data currently input in the Stat Editor is deleted whenever
you exit the STAT Mode, switch between the single-variable and a paired-
variable statistical calculation type, or change the Stat Format setting on the
setup menu. • The following operations are not supported by the Stat Editor:
m
,
1m
(M–),
1t
(STO). Pol, Rec, and multi-statements also cannot
be input with the Stat Editor.
To change the data in a cell:
In the Stat Editor, move the cursor to the cell
that contains the data you want to change, input the new data, and then
press
=
.
To delete a line:
In the Stat Editor, move the cursor to the line that you want
to delete and then press
Y
.
To insert a line:
In the Stat Editor, move the cursor to the location where
you want to insert the line and then perform the following key operation:
1
1
(STAT)
3
(Edit)
1
(Ins).
To delete all Stat Editor contents:
In the Stat Editor, perform the following
key operation:
1
1
(STAT)
3
(Edit)
2
(Del-A).
Obtaining Statistical Values from Input Data
To obtain statistical values, press
A
while in the Stat Editor and then
recall the statistical variable (
σ
x
,
Σ
x
2
, etc.) you want. Supported statistical
variables and the keys you should press to recall them are shown below.
For single-variable statistical calculations, the variables marked with an
asterisk (*) are available.
Sum:
Σ
x
2
*,
Σ
x
*,
Σ
y
2
,
Σ
y
,
Σ
xy
,
Σ
x
3
,
Σ
x
2
y
,
Σ
x
4
1
1
(STAT)
3
(Sum)
1
to
8
Number of Items:
n
*,
Mean:
o
*,
p
,
Population Standard Deviation:
σ
x
*,
σ
y
,
Sample Standard Deviation:
s
x
*, s
y
1
1
(STAT)
4
(Var)
1
to
7
1
1
STAT
STAT
STAT
STAT
STAT
STAT

