35
uuuuu
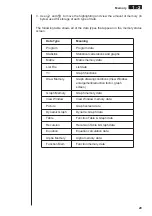
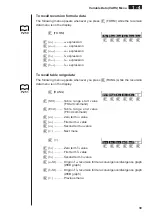
To recall single/paired-variable statistical data
Pressing
3
(STAT) while the variable data menu is on the screen displays a statis-
tical data menu.
3
(STAT)
1
(X) ............ S i n g l e / p a i r e d - v a r i a b l e
x
-data menu
2
(Y) ............ Paired-variable
y
-data menu
3
(GRPH) .... Statistical graph data menu
4
(PTS) ....... Summary point data menu
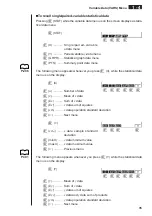
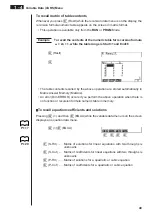
The following menu appears whenever you press
1
(X), while the statistical data
menu is on the display.
1
(X)
1
(
n
) ............ Number of data
2
(
o
) ............. Mean of
x
data
3
(
Σ
x
) .......... Sum of
x
data
4
(
Σ
x
2
) .........
x
data sum of squares
5
(
x
σ
n
) .........
x
data population standard deviation
6
(
g
) ........... Next menu
6
(
g
)
1
(
x
σ
n
-1
) .......
x
data sample standard
deviation
2
(minX) ......
x
data minimum value
3
(maxX) .....
x
data maximum value
6
(
g
) ........... Previous menu
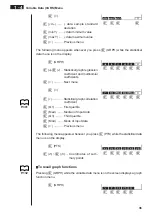
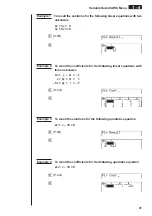
The following menu appears whenever you press
2
(Y) while the statistical data
menu is on the display.
2
(Y)
1
(
p
) ............. Mean of
y
data
2
(
Σ
y
) .......... Sum of
y
data
3
(
Σ
y
2
) .........
y
data sum of squares
4
(
Σ
xy
) .........
x
data and
y
data sum of products
5
(
y
σ
n
) .........
y
data population standard deviation
6
(
g
) ........... Next menu
1 2 3 4
5 6
1 2 3 4 5 6
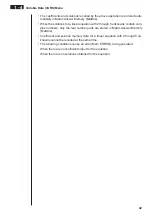
Variable Data (VARS) Menu
1 - 4
P.296
P.301
1 2 3
4 5
6
1 2 3 4 5 6

