37
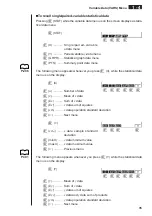
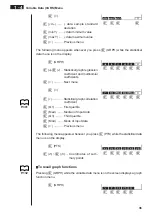
Input a storage area number and then press one of the following function keys to
recall the corresponding graph function stored in that storage area.
1
(Y) ............ Rectangular coordinate or inequality function
2
(
r
) ............. Polar coordinate function
3
(Xt) ........... Parametric graph function Xt
4
(Yt) ........... Parametric graph function Yt
5
(X) ............ X=constant graph function
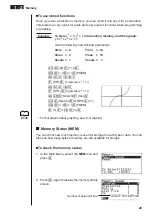
Example
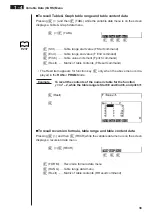
To recall and draw the graph for the rectangular coordinate
function
y
= 2
x
2
– 3, which is stored in storage area Y2
Use the following View Window parameters to draw the graph.
Xmin
= –5
Ymin
= –5
Xmax = 5
Ymax = 5
Xscale = 1
Yscale = 1
!4
(Sketch)
5
(GRPH)
1
(Y=)
J
4
(GRPH)
1
(Y)
c
w
uuuuu
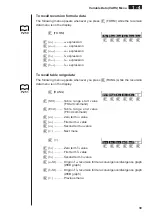
To recall Dynamic Graph set up data
Pressing
5
(DYNA) while the variable data menu is on the screen displays a Dy-
namic Graph set up menu.
5
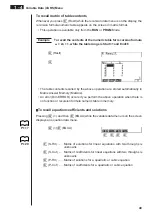
(DYNA)
1
(Strt) ......... Coefficient range start value
2
(End) ........ Coefficient range end value
3
(Pitch) ...... Coefficient value increment
P.211
1 2 3
4 5 6
Variable Data (VARS) Menu
1 - 4

