20050401
6-6 Confidence Interval
A confidence interval is a range (interval) that includes a statistical value, usually the
population mean.
A confidence interval that is too broad makes it difficult to get an idea of where the population
value (true value) is located. A narrow confidence interval, on the other hand, limits the
population value and makes it difficult to obtain reliable results. The most commonly used
confidence levels are 95% and 99%. Raising the confidence level broadens the confidence
interval, while lowering the confidence level narrows the confidence level, but it also
increases the chance of accidently overlooking the population value. With a 95% confidence
interval, for example, the population value is not included within the resulting intervals 5% of
the time.
When you plan to conduct a survey and then
t
test and
Z
test the data, you must also
consider the sample size, confidence interval width, and confidence level. The confidence
level changes in accordance with the application.
1-Sample
Z
Interval
calculates the confidence interval for an unknown population mean
when the population standard deviation is known.
2-Sample
Z
Interval
calculates the confidence interval for the difference between two
population means when the population standard deviations of two samples are known.
1-Prop
Z
Interval
calculates the confidence interval for an unknown proportion of
successes.
2-Prop
Z
Interval
calculates the confidence interval for the difference between the propotion
of successes in two populations.
1-Sample
t
Interval
calculates the confidence interval for an unknown population mean
when the population standard deviation is unknown.
2-Sample
t
Interval
calculates the confidence interval for the difference between two
population means when both population standard deviations are unknown.
On the initial
STAT
mode screen, press
4
(INTR) to display the confidence interval menu,
which contains the following items.
•
4
(INTR)
1
(Z) ...
Z
intervals (page 6-6-3)
2
(t) ...
t
intervals (page 6-6-8)
# There is no graphing for confidence interval
functions.
6-6-1
Confidence Interval
Summary of Contents for fx-9860G AU PLUS
Page 1: ...fx 9860G AU User s Guide E http edu casio com ...
Page 2: ...Important Please keep your manual and all information handy for future reference ...
Page 27: ...20050401 1 1 Keys 1 1 1 Keys ...
Page 335: ...20050401 u u u u u Input Example u u u u u Results 6 5 25 Tests ...
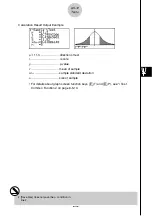
Page 361: ...20050401 Calculation Result Output Example p F distribution probability 6 7 15 Distribution ...
Page 435: ...20050401 8 8 2 Program Library egcw w ww w ...
Page 437: ...20050401 8 8 4 Program Library Example 1 Example 2 fw baw bf w fw baw ca w ...
Page 439: ...20050401 8 8 6 Program Library wba wb w w d ...
Page 441: ...20050401 8 8 8 Program Library dw fcde wfcde wfcde fcde w daw w 20070101 ...
Page 443: ...20050401 8 8 10 Program Library b awaw bwaw aw x d w ...
Page 590: ...CASIO COMPUTER CO LTD 6 2 Hon machi 1 chome Shibuya ku Tokyo 151 8543 Japan SA0701 E ...

