5-16
2
(FACT)
Specifies the
x
-axis and
y
-axis zoom factors for factor zoom.
3
(IN)/
4
(OUT) ... Factor zoom
The graph is enlarged or reduced in accordance with the factor
you specify, centered on the current pointer location.
6
(
g
)
1
(ORIG) ... Original size
Returns the graph to its original size following a zoom operation.
6
(
g
)
2
(SQR) ... Graph correction
V-Window
x
-axis values are corrected so they are identical to
the
y
-axis values.
6
(
g
)
3
(RND) ... Coordinate rounding
Rounds the coordinate values at the current pointer location.
6
(
g
)
4
(INTG) ... Integer
Each dot is given a width of 1, which makes coordinate values
integers.
6
(
g
)
5
(PRE) ... Previous
V-Window parameters are returned to what they were prior to
the last zoom operation.
Box zoom range specification
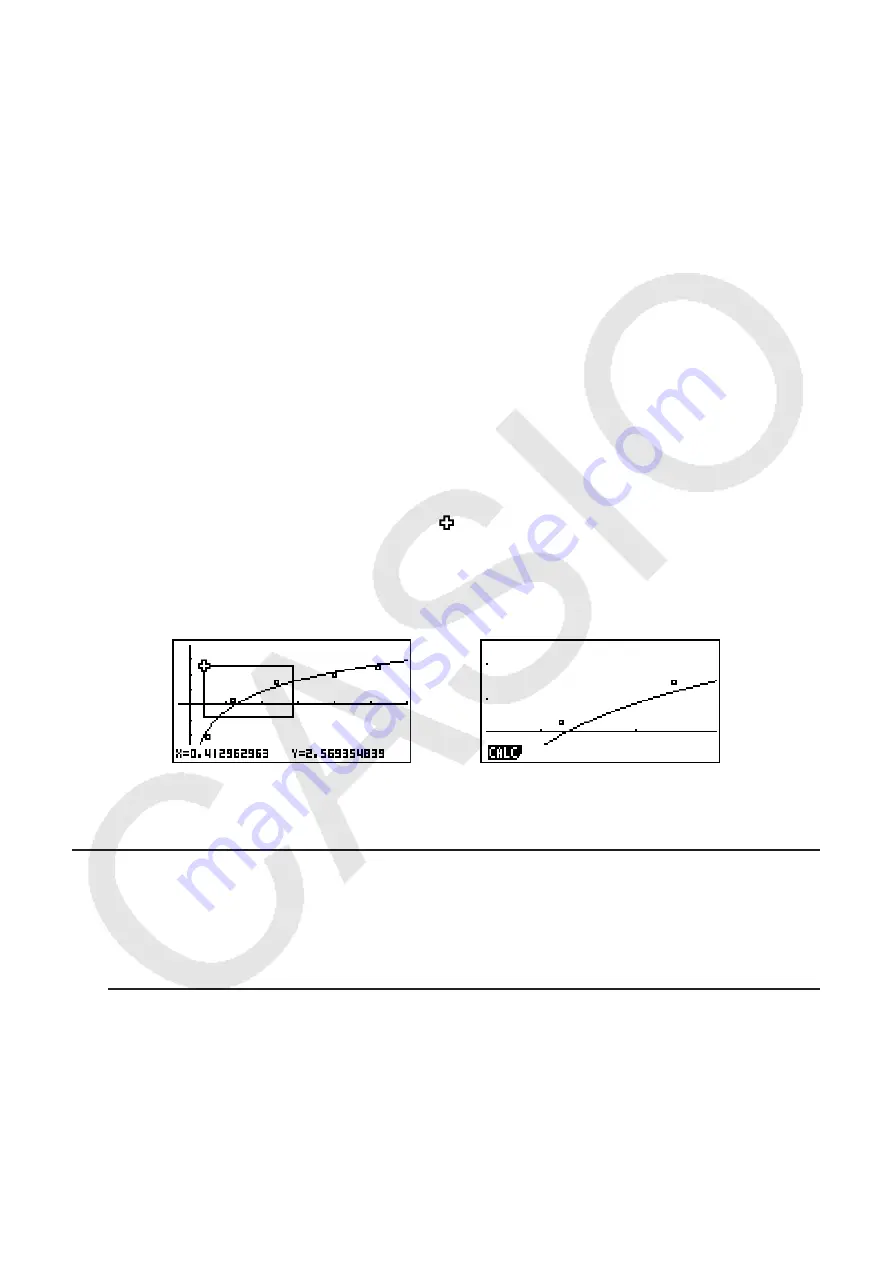
3. Use the cursor keys to move the pointer (
) in the center of the screen to the location
where you want one corner of the box to be, and then press
w
.
4. Use the cursor keys to move the pointer. This causes a box to appear on the screen. Move
the cursor until the area you want to enlarge is enclosed in the box, and then press
w
to
enlarge it.
• You must specify two different points for box zoom, and the two points cannot be on a
straight line vertically or horizontally from each other.
k
Configuring View Window Settings Manually
When “Manual” is selected for the setup screen’s “Stat Wind” setting (page 2-15), the
calculator draws statistical graphs in accordance with the settings currently input on the View
Window.
u
To configure View Window settings manually
1. On the
STAT
mode List Editor screen or graph screen, press
!3
(V-WIN).
⇒
⇒


