Statistical Report
Catalyst Enterprises, Inc.
47
Statistical Report
Whenever a captured sample is displayed in the sample viewer, the
Statistical Report
selection in the
Report
menu and a
Statistical Report Button
on the viewer toolbar
are enabled. You may create a Statistical Report for the entire capture or a select
portion of it as desired.
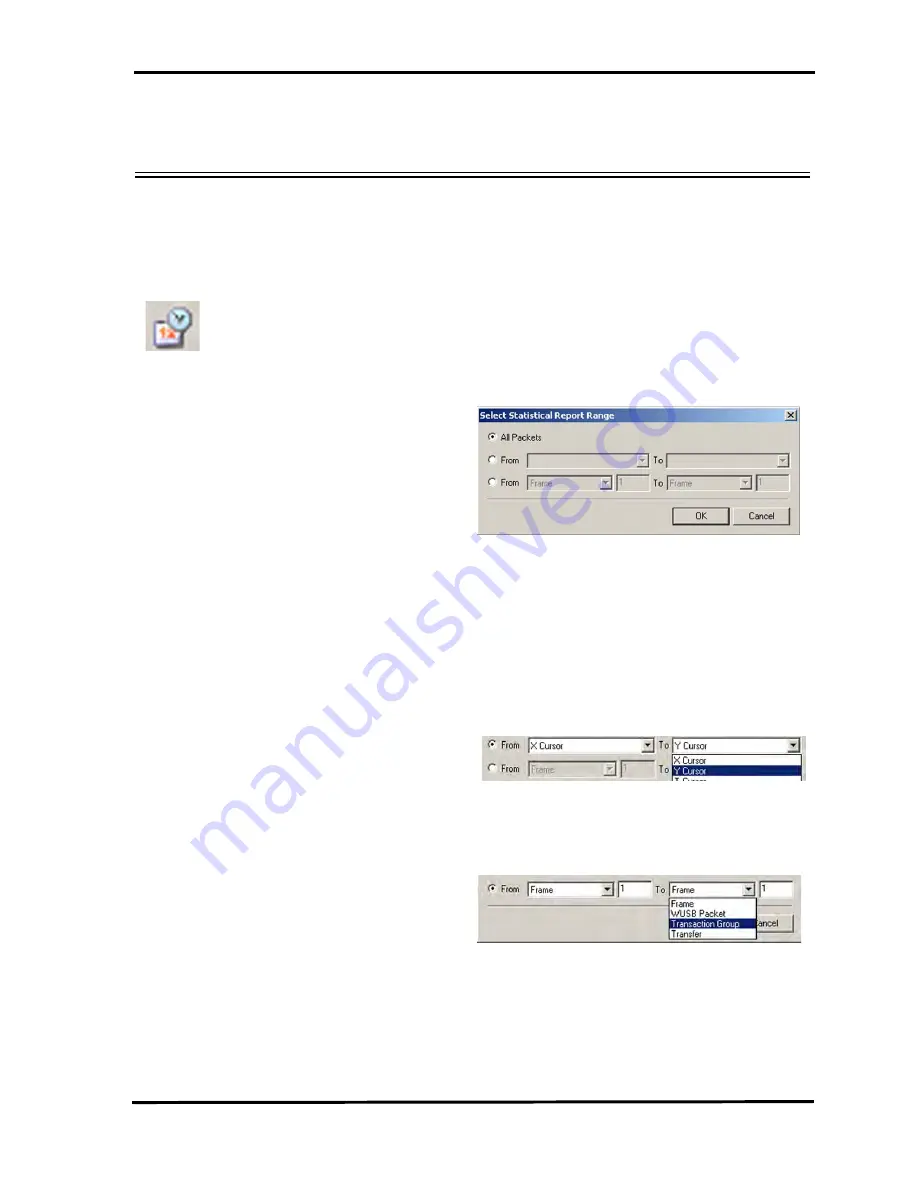
Figure 33. Statistical Report Range Dialog
The default statistical report is generated using all samples. You may, however, set a
specific Statistic report range between defined cursor positions or events.
Report Between Cursors
Click the option button next to the
From
cursor selection drop down list.
Then click the
From
down arrow and choose the 1st. cursor, click the
To
down arrow to choose the 2nd cursor and click
OK.
The resulting report
is limited to the capture between the cursors.
Report Between Events
Click the option button next to the
From
the event selection dropdown
list. Then click the
From
down arrow to choose the 1st event and enter
the number of its occurrence. Next click the
To
down arrow to choose the
2nd event, and enter the number of its occurrence.
Click
OK.
The resulting report will be limited to the capture between the
defined events.
To display a Statistical Report, click the
Statistical Report
button on the viewer
toolbar, or select
Statistical Report
from the
Report
menu.
Summary of Contents for AirCom UWB Analyzer
Page 1: ...March 2007 P N 400 0103 001 User s Manual Version 1 22 ...
Page 4: ...Catalyst Enterprises Inc Copyright iv ...
Page 54: ...Catalyst Enterprises Inc Faded Packets 46 Figure 32 Illustration of Faded Packets ...
Page 76: ...Catalyst Enterprises Inc Display Configuration 68 ...
Page 109: ......


