CD42 Pipeline Pig Location & Tracking System
Page 27
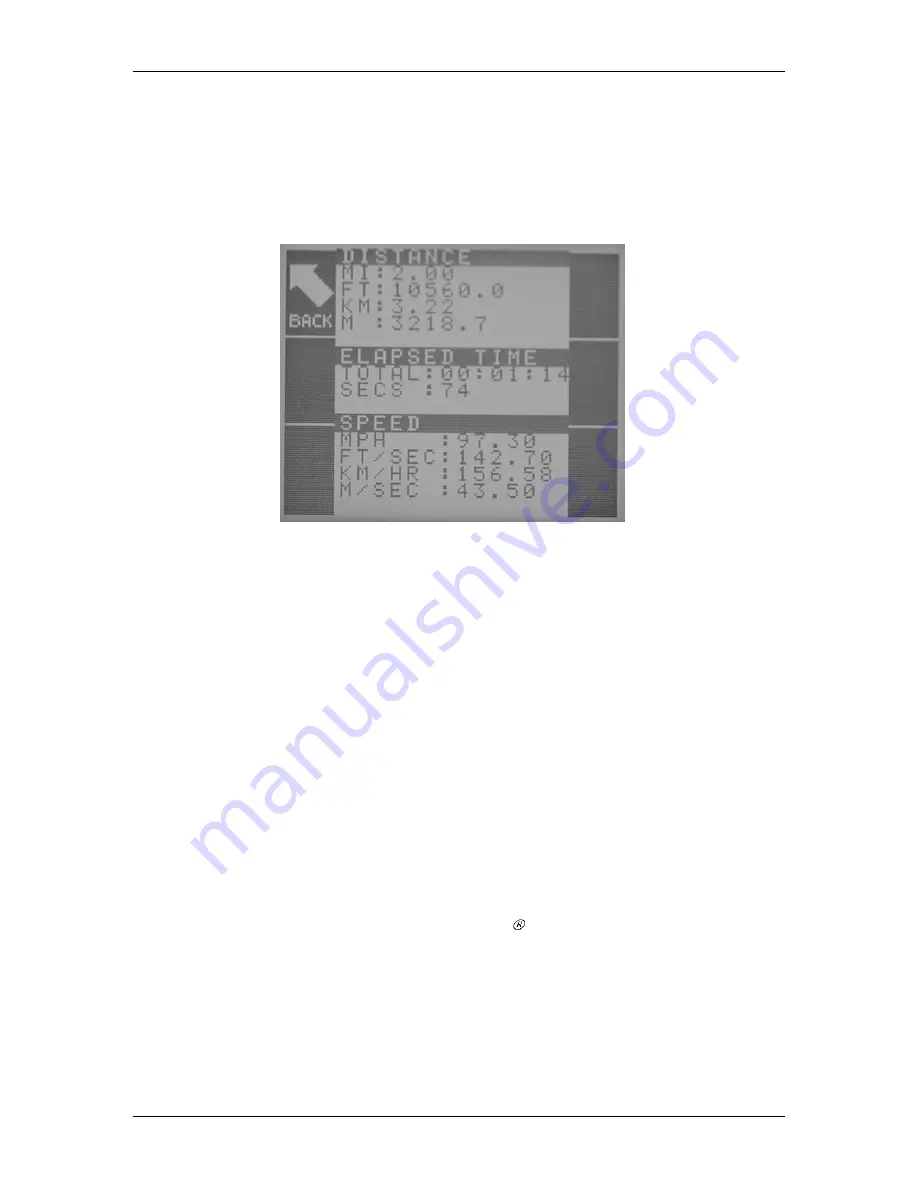
The CD42-R will now use the data that was saved with the PIC file to calculate the pig speed. A
screen similar to the one in Figure 34 will display the pig speed information.
Figure 34
Pig Speed Information
The pig speed information is divided into three sections labeled Distance, Elapsed Time, and Speed.
The
Distance
section displays the total distance the pig traveled between the two Location ID‟s
entered with the file recording. This distance is displayed in Miles, Feet, Kilometers, and Meters.
The
Elapsed Time
section displays the time it took the pig to travel between the two points. This
information is displayed two ways. The first line is TOTAL, which includes hours, minutes, and
seconds. The second line is SECS, which is the total number of seconds.
The
Speed
section displays the average speed of the pig. This is displayed in Miles Per Hour, Feet
Per Second, Kilometers Per Hour, and Meters Per Second.
The pig speed is calculated as an average speed between the two selected files. If the first and last
recordings are tagged then the average pig speed is calculated for the entire run.
To exit the Calc Pig Speed screen, press the Back button to return to the File Submenu.
Print a Recording File
The CD42-R PICture files may be printed to any Epson compatible dot matrix printer.
To print a PICture file, it is necessary to remove the gray Access Plate on the rear of the CD42-R
receiver unit. The Access Plate is removed by removing the four screws securing the Access Plate
to the CD42-R. Once the Access Plate is removed, the operator can connect a standard printer cable
to the printer port connector on the CD42-R. The printer port is easily identifiable; it is the large 25
pin connector.


