When the sensor is properly connected, the orange LED goes out and the green one starts flashing
and three short beeps are heard. The green LED now flashes the mobile signal strength every 30 se-
conds for three minutes. 3 blink=high level, 2=medium and 1=low. Feel free to move the transducer to
achieve the best possible strength. A better signal strength gives a longer battery life.
After three minutes, the sensor switches to measuring and transmitting every three hours to save
battery power. Measurement and transmission intervals are adjustable in the Celsiview cloud service.
Measuring more often than every three hours will affect the properties of the wood material (measu-
rement object) and may result in inaccurate readings. To restart the above process or if the sensor does
not connect properly, disconnect one battery, wait 60 seconds and reconnect it again.
Add/change measurement locations linked to the sensor
Each MM601 sensor delivers 8 measurement values if 8
MM600P1 measurement nodes are connected. 8
Login to celsiview.se (Version 2 Beta).
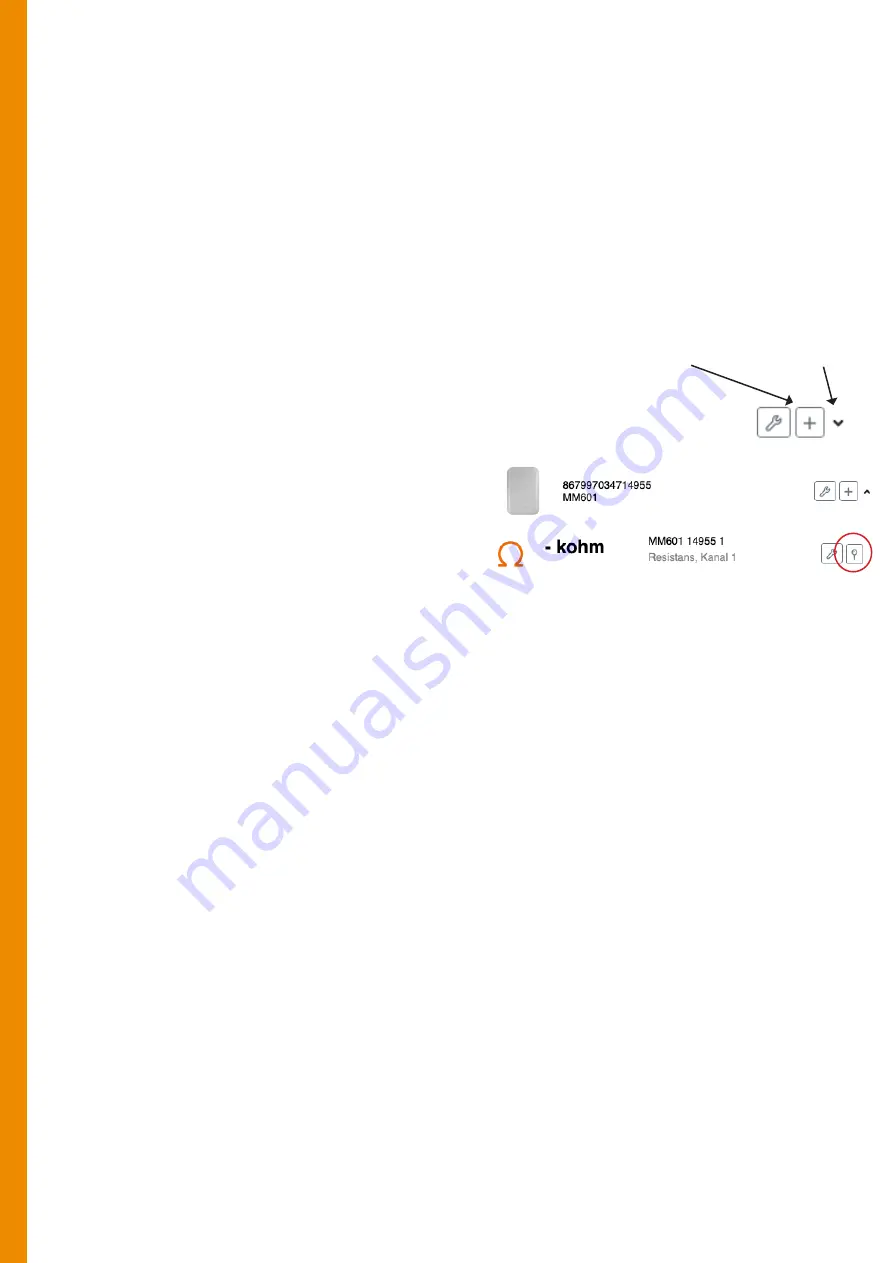
Click on ”Sensors” in the menu. At the far right of the
line for the sensor, some symbols are displayed.
To add all 8 channels as readings to your sensor
location list click on the plus sign and enter a
name/prefix for the readings, e.g. ”Moisture con-
tent sensor”. Press ”OK”. The locations are now
created and can be found under the menu item
”Locations”.
If only a single MM600P1 measurement node is to be used, click on the symbol with a down arrow.
All 8 channels of the sensor will be opened. Now click on the map pin (location) on the channel (1 to
8) where a measuring node is connected. Select ”Create location”, enter a name for the measurement
location and save.
To change a setting/name of a location, e.g. set the measurement curve (fur/spruce/Protimeter WME),
click on ”Locations” in the menu and then on the tool symbol on the right of the line or click on a line
and select ”Go to settings”.
By clicking on the star symbol on the far right of a location row, or selecting ”Make a favorite” after
clicking on a row, that measurement will appear as a favorite (widget) on the home screen. (Menu item
”Home”)
The options ”Settings”, ”Reports” and ”Make a favourite” etc. are also accessible by simply clicking on
any row/location on the ”Locations” page.
Reports
To print or export reports/measurements, click on ”Reports” in the menu. Select what to display in the
report/graph by the menu options above the graph. It also selects the time period you want to look at.
Click on the ”Export” button to download or send the report as e.g. an Excel file or PDF.
Add all channels Add single channels


