CHARTNAV 343
26
4.4 Track Plot Mode
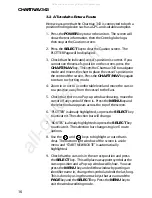
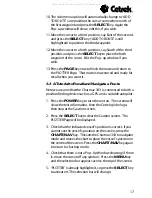
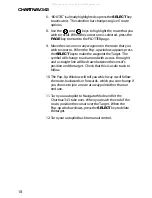
When the Track Plot Mode is switched on there are additional
Zoom Levels, this is useful for areas where there is no data.
If a larger-scale chart is not available when Zooming IN, the
Chartnav will automatically turn the Track Plot Mode on and
Cartography off. The Zoom In function will still operate down
to 0.005 nm per scale length.
4.5 Chart Boundaries
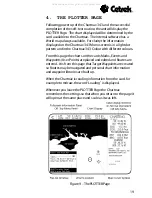
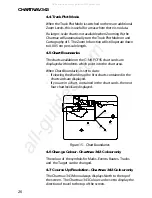
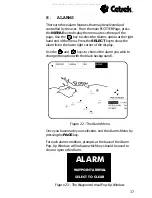
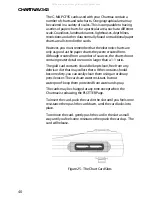
The charts available on the C-MAP CF95 chart cards are
displayed with indents which point into the chart area.
When Chart Boundaries is set to Auto:
If viewing the World map the first charts contained in the
chart cards are displayed.
If you are in a chart, contained in the chart cards, the next
four chart levels are displayed.
Figure 15 - Chart Boundaries
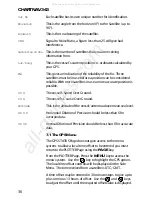
4.6 Change Colour - Chartnav 343 Colour only
The colour of the symbols for Marks, Events, Routes, Tracks
and the Target can be changed.
4.7 Course Up/Resolution - Chartnav 343 Colour only
The Chartnav 343 Mono always displays North to the top of
the screen. The Chartnav 343 Colour can be set to display the
direction of travel to the top of the screen.
All manuals and user guides at all-guides.com
all-guides.com

