background image

4 Operation Guide 

4.1 Function operation guide


33 


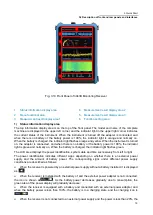
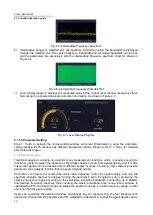
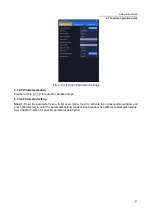
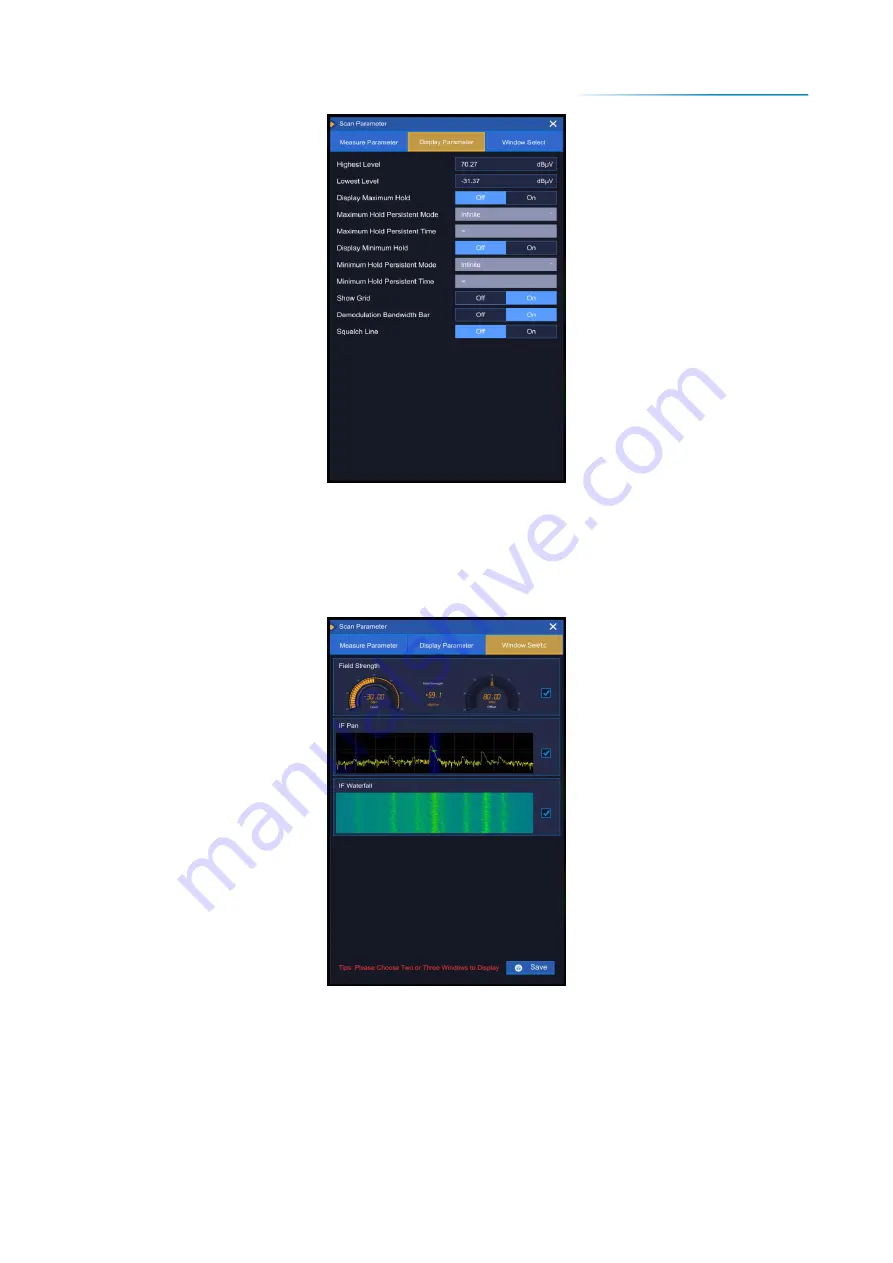
Fig. 4.3 Parameter Setting Window 

4.1.1.4 Window selection 

Step  1.

  Touch  to  activate  any  window,  press  [Parameter]  to  enter  the  parameter  setting  window,  and 

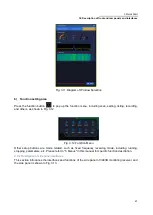
press [Window Selection] to enter the window selection interface, as shown in Fig. 4.4. 


Fig. 4.4 Window Selection 

Step 2.

 Click the required window option to activate the option and highlight the prompt after selection, 

and finally click [Save]. 

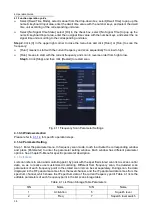
In fixed frequency receiving mode, 2-3 windows from 3 kinds of windows can be selected for display: 

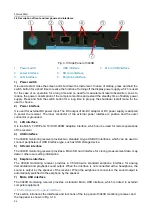
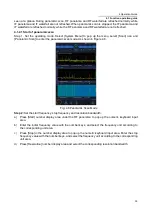
a)  Intermediate frequency panorama: displays the frequency spectrum within the bandwidth, and can 

set the center frequency, frequency bandwidth and resolution bandwidth. As shown in Figure 4.5. 

Summary of Contents for 3943B

Page 1: ...CN Version No Technical status identification Confidential Non confidential 3943B Monitoring Receiver Operations Manual Prepared by Reviewed by Standardized by Countersigned by Approved by Ceyear Tech...

Page 2: ...3943B Monitoring Receiver User s Manual Ceyear Technologies Co Ltd...

Page 3: ...tion within the warranty period For this purpose the user shall return the product to the manufacturer and prepay the mailing fee The manufacturer will return the fee to the user together with the pro...

Page 4: ......

Page 5: ...t 8 3 1 Get Prepared 8 3 1 1 Preparations before Operation 8 3 1 2 Precautions before energization 11 3 1 3 Battery use instructions 13 3 1 4 Startup shutdown and screen off 14 3 1 5 Correct Use of co...

Page 6: ...enu 55 5 1 10 Playback menu 56 5 2 Window menu 59 5 2 1 Fixed frequency receiving 59 5 2 2 Panoramic scan 64 5 2 3 Frequency scan 69 5 2 4 Scan the list 72 6 Remote control 75 6 1 Remote control princ...

Page 7: ...mon fault phenomena and troubleshooting methods 95 7 3 Error message 96 7 3 1 Error message file 96 7 3 2 Error message description 97 7 4 Method to obtain after sales services 97 7 4 1 Contact us 97...

Page 8: ...lation 144 Detector Mode 144 Drift 144 Span 144 Frequency range 145 Frequency accuracy 145 Frequency stability 145 Flatness 145 Measurement time 145 Measurement mode 145 Input impedance 145 Explicit a...

Page 9: ...quent detailed introduction of the instrument measurement operating manual This section contains some contents consistent with the relevant sections in Quick Start Operation Guide It introduces in det...

Page 10: ...eration methods of the instrument in detail including configuration measurement program control and maintenance etc It aims to guide the user to comprehensively understand the functional characteristi...

Page 11: ...safety guarantee The design and testing of our products and the auxiliary equipment used meet relevant safety standards and a quality assurance system has been established to monitor the product quali...

Page 12: ...ive devices with care EU symbol for electronic devices separate collected Please refer paragraph 2 of 2 2 8 Waster Disposal Environmental Protection in this section for specific instructions Warning R...

Page 13: ...ctric leakage will be caused resulting in damage to the instrument and even injury of the operators If an external power cord or extension socket is used it should be checked before use to ensure elec...

Page 14: ...adiation sources to prevent personal injury 6 In case of fire the damaged instrument will release toxic substances Therefore the operators should wear appropriate protective equipment e g Protective m...

Page 15: ...vices should be collected separately and disposed of in a suitable collection location or through the customer service center of the manufacturer 2 Do not dispose of waste electronic devices together...

Page 16: ...1 1 Preparations before Operation This chapter introduces the precautions for initial setting and operation of the 3943B monitoring receiver Prevent personal injuries and instrument damages To avoid...

Page 17: ...tic compatibility EMC level marking in the technical indicators 1 Unpacking inspection Step 1 Check whether the outer packing box and shockproof package are damaged In case of any damage keep the oute...

Page 18: ...bove environmental requirements are only applicable to the operating environment factors of the instrument and are not with the scope of technical indicators 3 Instrument operation mode The 3943B moni...

Page 19: ...t time Operators must wear anti static wrist straps or take other antistatic measures before touching the joints core or conducting any assembly Voltage range The above anti static measures shall not...

Page 20: ...oor grounding may cause damage to the instrument and even injury to the operator Using a power cord without protective grounding is strictly prohibited When the instrument is connected to a suitable p...

Page 21: ...pacity should not be less than 5 as far as possible otherwise the battery may not be rechargeable The battery insertion port of 3943B monitoring receiver is located at the lower left side of the instr...

Page 22: ...he adapter is no longer in use do not connect it to the power supply Do not charge the battery with a charger that is not specified and has no safety certification Do not charge the battery for more t...

Page 23: ...ill be turned off Perform the same operation again and the screen display of the instrument will be turned on Power cut of the instrument When the instrument is in normal working state it can be shut...

Page 24: ...ale connector slide concentrically into the jack of the female connector Fig 3 6 Diagram of Connector Connection Step 2 As shown in Fig 3 7 horizontally move two connectors to make then connected smoo...

Page 25: ...1 Cleaning instrument surface Please follow the steps below when cleaning the surface of the instrument Step 1 Turn off the instrument by disconnecting the power line connected to the instrument Step...

Page 26: ...requency input port on the top panel of the 3943B monitoring receiver is a 50 connector If the impedance connector is not matched the test result will be affected 3 2 Description of front and rear pan...

Page 27: ...battery or the battery power is 100 the indicator light is green and normally on When the battery is charged the indicator light flashes green The LCD area displays the power identification system da...

Page 28: ...us manually set the gain or automatically control the gain according to the signal Squelch level Set the squelch level which only works when squelch is turned on Howling Set the howling switch When th...

Page 29: ...and others as shown in Fig 3 12 Fig 3 12 Function Menu Other setup buttons are mode related such as fixed frequency receiving mode including running stopping parameters etc Please refer to 5 Menus in...

Page 30: ...he outer conductor is grounded 3 LAN interface It is the RJ45 TCP IP and 10 100 1 000M adaptive interface which can be used for remote operations of the receiver 4 USB interface The 3943B monitoring r...

Page 31: ...range of the source should be 5V 5V It can be set by the program whether it is triggered by rising edge or falling edge 3 GNSS antenna It is the antenna equipment connected with GNSS which can be used...

Page 32: ...ormed 1 Connect the synthetic signal generator and the 3943B monitoring receiver according to Fig 3 15 Fig 3 15 Schematic Diagram of Sinusoidal Signal Connection for Measurement 2 Set the parameters o...

Page 33: ...nd displayed in the active functional area At this time the cursor reading frequency is 1GHz and the magnitude is about 29 96dBm as shown in Fig 3 17 Fig 3 17 Sinusoidal Signal Measurement Results Act...

Page 34: ...able the factory startup state will be called by default Usually when the measurement state of the instrument is wrong the initial state of the instrument under normal operation can be restored by res...

Page 35: ...state separately Click the edit icon behind user reset to enter the reset call dialog box as shown in Fig 3 21 Fig 3 21 Reset Call Dialog Box If the user has saved multiple reset states the user can...

Page 36: ...3B monitoring receiver provides seven kinds of file saving functions and six kinds of file calling functions The seven types of files that can be saved are reset status file trace file image audio sto...

Page 37: ...3 Quick Start 3 4 Data Management 29 Fig 3 22 Screen Saving Interface Click Save button to save the screen shots...

Page 38: ...ied out after the antenna is installed so as to monitor the signal In order to judge the signal more visually it is usually necessary to use demodulation processing function to directly demodulate the...

Page 39: ...ion bandwidth If there is no special demand select Auto and the resolution bandwidth is adaptive bandwidth under this option Demodulation frequency and center frequency can be set independently but th...

Page 40: ...of reference level The reference levels of IF and RF spectrum can be modified in two ways 1 Touch operation The reference level can be modified by sliding down the corresponding window with a single...

Page 41: ...ace as shown in Fig 4 4 Fig 4 4 Window Selection Step 2 Click the required window option to activate the option and highlight the prompt after selection and finally click Save In fixed frequency recei...

Page 42: ...amic scan Traditional spectrum analysis can perform many measurement functions which is usually enough for laboratory users However the execution of field tasks needs to search for signals quickly and...

Page 43: ...to enter the panoramic scan mode As shown in Figure 4 8 Fig 4 8 Panoramic Scan Mode Step 2 Set the start frequency stop frequency and resolution bandwidth a Press Start number display area under the R...

Page 44: ...ncy point At each dwell point measurement shall be implemented once to judge whether there is a signal when the squelch switch is turned on the amplitude is greater than or equal to the squelch level...

Page 45: ...r to pop up the numeric keyboard input area Enter the stop frequency value with the number keys and select the frequency unit according to the corresponding unit area Fig 4 10 Suppression Table Editin...

Page 46: ...n Parameter Settings 4 1 3 3 Window selection Please refer to 4 1 1 4 for specific operation steps 4 1 3 4 Parameter Setting Step 1 Enter the parameter menu In frequency scan mode touch to activate th...

Page 47: ...down box and select the corresponding demodulation mode Click Attenuation Mode at the bottom of the list to pop up the attenuator mode drop down box and select the corresponding attenuator mode Click...

Page 48: ...and select the dwell time unit according of the corresponding unit area Select No Signal Time State select On in the check box select No Signal Time to pop up the numeric keyboard input area enter the...

Page 49: ...refer to 4 1 1 4 for specific operation steps 4 1 4 4 Parameter Setting Step 1 Enter the parameter menu In list scan mode touch to activate the corresponding window and press Parameter to enter the pa...

Page 50: ...m e n u 4 4 Setting menu 46 L i s t m e n u 5 0 Record menu 53 F i l e m e n u 5 5 Self inspection menu 57 Frequency marker menu 57 Antenna menu 59 P e a k m e n u 6 0 Playback menu 60 5 1 1 Scan men...

Page 51: ...Scan Mode When you select List Scan the menu items are shown in Fig 5 6 Fig 5 6 Secondary Menu of List Scan Mode 5 1 2 Setting menu After clicking the setting menu the related secondary menu pops up...

Page 52: ...l the frequency range is 20MHz 30MHz and the default value is 20MHz Frequency Reference Set frequency reference mode including internal reference external reference and GNSS reference and the default...

Page 53: ...g and Timing Source Set the positioning and timing sources including GPS GNSS Beidou Beidou GNSS and off modes which is off by default Positioning Status Display the current positioning status and cli...

Page 54: ...Network settings The network setting property page is shown in Fig 5 9 Fig 5 9 network Setting Property Page Parameters in the network setting property page are described as follows IP Address Set th...

Page 55: ...n update and support using USB flash drive to update programs When inserting USB flash drive the version update button is available Click the version update button to detect the version update If ther...

Page 56: ...re Copy to Suppress Table Activate All Suppress All Delete All Ascend Descend Import and Export Their functions are detailed as follows Jump Input Box Jump to the specified storage table line number C...

Page 57: ...Suppression Table At the bottom of the suppression table there are jump input boxes and some buttons to operate the suppression table including Copy to Storage Table Add Suppression Table Delete Dele...

Page 58: ...Spectrum Fig 5 15 Record Mode Audio 5 1 4 1 IQ records Enter the IQ record menu and click Setting to pop up the setting box option as shown in Fig 5 16 Fig 5 16 IQ Setting Parameter Box Parameters in...

Page 59: ...button to start recording as shown in Fig 5 19 Fig 5 19 Spectrum Recording Process 5 1 4 3 Audio record Enter the audio recording menu and click Setting to pop up the setting box option as shown in Fi...

Page 60: ...the internal storage path is displayed As shown in Figure 5 22 Fig 5 22 Internal File List There are six file operation buttons at the bottom of the file list which are Select All Create New Directory...

Page 61: ...the secondary menu related to the frequency scale as shown in Figure 5 24 Figure 5 24 Frequency scale menu Frequency scale menu is described as follows Frequency Scale Activate the IF panorama window...

Page 62: ...ch to the peak menu the peak menu includes left adjacent peak right adjacent peak peak frequency scale center frequency scale demodulation several menus as shown in Fig 5 26 Fig 5 26 Peak menu The spe...

Page 63: ...the edit box below the antenna list these information mainly include the antenna name the starting and ending frequencies of the antenna the starting and ending frequencies of the antenna used and te...

Page 64: ...pports playback of the spectrum and audio data files recorded by this machine The playback menu is shown in Fig 2 9 Fig 5 29 Playback menu 5 1 10 1 Spectrum playback Click Playback Mode menu to select...

Page 65: ...file you want to play back as shown in Fig 5 32 Fig 5 32 Spectrum file selection Select the file and click Read to enter the spectrum playback status as shown in Fig 5 33 Fig 5 33 Spectrum playback 5...

Page 66: ...e audio Click Playback Selection to bring up the file options and you can select any file you want to play back as shown in Fig 5 35 Fig 5 35 Audio file selection Select the file and click Read to ent...

Page 67: ...37 mainly includes run stop and parameter settings several menus where the run and stop menu are mainly used to control the scanning state press Parameters menu the parameter settings dialog box pops...

Page 68: ...ower limit of the level display the default value is 10dBuV Level Display Range Set the level display range default select 60 00dB Level Unit Set the level unit including dBm dBuV Demodulation Bandwid...

Page 69: ...ber of windows selected is incorrect please choose again 5 2 1 2 IF panoramic window The parameter setting dialog box corresponding to the IF panorama window contains three property pages for the meas...

Page 70: ...t the measurement time the range is 500 s 900s The default value is set to 500 s and valid when the measurement time mode is manual Frequency Step Mode Set the frequency step mode including the automa...

Page 71: ...Minimum Hold Duration Set the minimum hold duration which valid when the minimum hold mode is manual Range 500ms 60s the default value is set to 2s Grid Set whether the grid of the spectrum window is...

Page 72: ...e Panorama Scan menu The menu items mainly include several menus for running stopping and parameter setting In the panoramic scan mode you can choose any 2 3 windows in the four windows of IF panorama...

Page 73: ...in Fig 5 43 Fig 5 43 Measurement property pages under the RF Panorama window The measurement related parameters are described below Center Freq Set the center frequency with the range of 13 5kHz 7 999...

Page 74: ...by default Frequency Step Interval Set the frequency step interval which is valid when the frequency step mode is manual the range is 1Hz 1GHz the default value is 1MHz Differential Mode Set the diffe...

Page 75: ...ode Minimum Hold Duration Set the minimum hold continues time which valid when the minimum hold mode is set to manual The range is 500ms 60s and the default value is 2s Grid Set whether the grid of th...

Page 76: ...n the scan count mode is set to manual The setting range is 1 1000 and the default scan count is 1 Measurement Mode Set the measurement mode including two modes periodical and continuous and the defau...

Page 77: ...the waterfall the default compression ratio is set to 1 1 Waterfall Chart Color Set the color of the waterfall map including smooth rainbow rainbow extended cool grayscale five color modes the smooth...

Page 78: ...eter setting and window selection the same as the level field intensity window in 5 2 1 1 fixed frequency reception mode 5 2 3 2 IF panoramic window The parameter setting dialog box corresponding to t...

Page 79: ...ly calculated by the receiver Measurement Time Set the measurement time the range is 500 s 900s The default value is set to 500 s and valid when the measurement time mode is manual Dwell Time Mode Set...

Page 80: ...c scan forward for the frequency points saved in the list from the termination frequency Click Stop menu to stop the scanning of RF Panorama window and RF Waterfall window Click the Restart menu to re...

Page 81: ...types and the default is dynamic refresh Type Scan Count Mode Set the scan count mode including unlimited and manual modes The unlimited mode is set by default Scan Count Set the scan count which is...

Page 82: ...responding to the RF panorama window in list scan mode is the same as the window selection property page under 5 2 1 2 IF panorama window 5 2 4 5 RF waterfall window The parameter setting dialog corre...

Page 83: ...t s rear panel network port for remote control For details of the protocol please refer to 6 1 1 1 LAN interface Note 1 VISA Virtual Instrumentation Software Architecture is a set of standard software...

Page 84: ...OCKET Methods of identification of multiple instruments in programmable system If multiple instruments are connected in the network the individual IP addresses of the instruments and the associated re...

Page 85: ...commands used to realize instrument functions such as setting frequency The syntax also follows the SCPI specification b Instrument responses Instrument responses response message and service request...

Page 86: ...st of the devices are electronic measurement or excitation devices and communicate using the GPIB interface c Program message A programmed message is a combination of one or more properly formatted SC...

Page 87: ...used Meaning use They represent the part that must be contained In SENSe FREQuency SPAN range range must be replaced with the actual frequency and unit Example FREQuency SPAN 10MHz The part in braces...

Page 88: ...tware module in the instrument software the Command Interpreter is dedicated to parsing each incoming SCPI command The command interpreter uses a set of rules for distinguishing command tree paths to...

Page 89: ...tended numerical parameters Most measurements related to instrument commands use extended numeric parameters to specify physical quantities Extended numerical parameters receive all numeric parameters...

Page 90: ...st of the test data are of real number type and their formats can be basic decimal notation or scientific notation which are supported by most advanced programming languages Examples of real number re...

Page 91: ...value H indicates that the number is a hexadecimal value Q indicates that the number is an octal number The following are the various presentations of the decimal number 45 in the SCPI command B101101...

Page 92: ...an unfixed value FREQ STAR 1GHz STAR SPAN 1000000 The returned result can be current initial frequency value of the instrument before such command is sent since the host program will not execute the...

Page 93: ...STatus it is composed of all the statuses of the instrument Related parallel poll enable register PPE determines which bits of the STB act on the IST symbol 4 Output buffer The message returned by th...

Page 94: ...in the test system must receive and assess all instrument information with the following standard methods so as to realize functions of the status report system properly 1 Service request SRQ initiate...

Page 95: ...the error command sent by the controller to the instrument 6 2 Instrument program control port and configuration L A N 9 6 6 2 1 LAN SICL LAN is used to control 3943B monitoring receiver in Local Area...

Page 96: ...ic IP addresses not DHCP and does not support access to hosts through DNS and domain name servers it does not require the user to modify the subnet mask which is fixed to 255 255 255 0 within the inst...

Page 97: ...itController ViStatus status status viOpenDefaultRM defaultRM status viOpen defaultRM monitorString VI_NULL VI_NULL monitor 6 3 3 Initialize the instrument The following examples show how to initializ...

Page 98: ...char rd_Buf_Marker VI_READ_BUFLEN define VI_READ_BUFLEN 20 Open IF panoramic frequency scale pairs and query frequency scale peaks status viWrite monitor CALC IFP MARK MMAX 18 retCnt status viWrite mo...

Page 99: ...s used to realize actual communication between the instrument driver and instrument The bus specific I O software such as GPIB and RS 232 or the common standard I O software used across multiple buses...

Page 100: ...mbus Driver Studio which directly generates the IVI COM and IVI C driver and program installation packages The installed IVI driver is divided into the inherent IVI function group and instrument funct...

Page 101: ...ages 105 Method to Obtain After sales Services 107 7 1 Working principles In order to facilitate the user to understand the function of the 3943B monitoring receiver and better solve the problems enco...

Page 102: ...F signal which is amplified and filtered and mixed with a second local oscillator with a fixed frequency of 5085MHz to produce a 140MHz second IF After amplification and filtering the 2 band signal is...

Page 103: ...r messages you ve collected and we will coordinate with you to solve the problem as soon as possible For details please refer to the contact information provided in this manual or check online at www...

Page 104: ...ng receiver enters the normal scanning state a continuously refreshed trace can be seen on the interface However if some parameters of the instrument are not set properly the user may not be able to s...

Page 105: ...remote control mode errors are recorded in the error event queue of the status reporting system and can be queried with the command SYSTem ERRor The format is as follows Error code Error in error queu...

Page 106: ...o be eliminated contact us by phone or fax If it is confirmed that the monitoring receiver has to be returned for repairing pack it with the original packing materials and case by following the steps...

Page 107: ...those that cannot be tested by limited means for example the 50 connector The measured values are not guaranteed data and are measured at room temperature approx 25 C Measured value meas It indicates...

Page 108: ...AC voltage is applied between the power input end of the equipment power adapter and the casing there should be no breakdown flashover or flicker c During the operation of the equipment the current le...

Page 109: ...ion mode 158dBm 3 6GHz to 5 8GHz 154dBm 5 8GHz to 7 5GHz 151dBm 7 5GHz to 8GHz 5 Noise factor level channel 21dB at 100kHz test frequency 17dB at 1MHz test frequency 17dB at 11MHz test frequency 17dB...

Page 110: ...Hz to 1 5GHz 106dBm 1 5GHz to 3 6GHz 102dBm 3 6GHz to 8GHz 8 FM demodulation sensitivity 103dBm 9kHz to 30MHz 111dBm 20MHz to 1 5GHz 107dBm 1 5GHz to 3 6GHz 102dBm 3 6GHz to 8GHz 9 Third order interce...

Page 111: ...to 7GHz 80dBm 7GHz to 8GHz 16 Panoramic scanning speed 2 GHz s 17 Amplitude accuracy Better than 1 5dB 15 35 Better than 3dB 0 50 8 4 Additional information 1 Top port Table 8 2 Top port Front panel p...

Page 112: ...etic Signal Generator Recommend 1464 E8257D Figure 8 1 Diagram of the frequency span test c Test procedure 1 Connect the test equipment according to Fig 8 1 the equipment to be tested and wait for the...

Page 113: ...dBm in the Display Settings tab Set the device to be tested to fixed frequency reception mode FFM and set the center frequency according to auxiliary table B 2 3 Set the synthesized signal generator...

Page 114: ...ut using the frequency scale function of the vector network analyzer and recorded in the auxiliary table B 3 6 In the 1 5GHz to 8GHz band use the frequency scale function of the vector network analyze...

Page 115: ...4 If there are remaining response frequencies the remaining response frequencies should be removed d Test record and data processing Process the data in Auxiliary Table B 4 according to the following...

Page 116: ...of the test items Measure the reference sine signals at 10kHz 10kHz 100kHz and 100kHz off the carrier The phase noise index at each frequency deviation of the reference sinusoidal signal is at least...

Page 117: ...d b Test diagram and test instruments and equipment Synthetic Signal Generator Recommend 1464 E8257D Audio analyzer Recommend U8903A U8903B Fig 8 7 Schematic diagram of AM demodulation sensitivity tes...

Page 118: ...the equipment to be tested and the synthesized signal generator common time base the headphone interface of the equipment to be tested is connected to the input channel interface of the audio analyzer...

Page 119: ...the level of the third order intermodulation product that is Pin Pt expressed in dB where Pt is the level of the third order intermodulation product expressed in dBm as a unit b Test diagram and test...

Page 120: ...lues and recorded in the functional performance test record table A 1 IP3 Pin 2 4 Where IP3 third order intercept point value Pin the input signal level value the absolute value of the level differenc...

Page 121: ...ing the magnitude error 0 5dB 5 Set the center frequency of the equipment to be measured as the intermodulation product frequency according to the auxiliary table B 10 and measure the level value Pt o...

Page 122: ...he IF Panorama window set the bandwidth to 100 kHz and the resolution bandwidth RBW to auto Set the center frequency and attenuator status according to auxiliary table B 11 Set the level unit to dBm S...

Page 123: ...e same frequency with one signal frequency one IF lower than the LO and another signal frequency one IF higher than the LO In this case one of the signal is called the mirror frequency of the other Ea...

Page 124: ...e IF panoramic window of the device to be tested the level value of the mirror frequency interference signal is measured using the frequency scale and the value is recorded in the auxiliary table B 12...

Page 125: ...e measurement time to 350ms 2 Set the output frequency and power of the synthesized signal generator according to the auxiliary table B 13 which is the IF frequency of the equipment to be tested 3 Use...

Page 126: ...e scan mode to fixed frequency scan FFM Set the center frequency and attenuator status according to auxiliary table B 14 3 Set the center frequency of the signal spectrum analyzer according to the aux...

Page 127: ...e value and record it in the functional performance test record table A 1 8 5 1 16 Panoramic scan speed a Description of the test items Panoramic scan speed refers to the continuous band width of the...

Page 128: ...1 0 T 9 8 5 1 17 Magnitude accuracy a Description of the test items This test verifies the accuracy of the magnitude measurement of the input signal in the operating frequency range of the device to b...

Page 129: ...est frequencies in sequence to complete the test d Test record and data processing The magnitude error A of the corresponding frequency point is calculated according to Equation 10 and recorded in the...

Page 130: ...ion option Map function option Computer video leakage information detection and restoration function optional 3 Frequency range Lower frequency limit 9kHz Upper frequency limit 8GHz 4 Maximum linear o...

Page 131: ...Hz 100kHz frequency deviation Carrier 21MHz 115dBc Hz 10kHz frequency deviation 117dBc Hz 100kHz frequency deviation Carrier 500MHz 95dBc Hz 10kHz frequency deviation 95dBc Hz 100kHz frequency deviat...

Page 132: ...sion 1 IF dB 90dB 20MHz to 3 6GHz low noise mode 80dB 20MHz to 3 6GHz low distortion mode 70dB 3 6GHz to 8GHz 14 Mirror frequency suppression 2 IF dB 60dB 20MHz to 3 6GHz low noise mode 60dB 20MHz to...

Page 133: ...e equipment and the housing should be not less than 2M under humid environmental conditions Dielectric strength AC 1 5Kv 10mA 1min no arc no breakdown Leakage current mA Voltage 242V leakage current 3...

Page 134: ...m Setting frequency of the device to be tested Vector network analyzer test frequency point frequency band Test results Voltage SWR 11MHz 11MHz 30MHz 30MHz 75MHz 75MHz 90MHz 90MHz 160MHz 160MHz 220MHz...

Page 135: ...ble B 5 Test of noise coefficient Item Test frequency Attenuation control Level reading Test results Noise Figure 100kHz dBm dB 1MHz dBm dB 11MHz dBm dB 19MHz dBm dB 50MHz Off dBm dB 140MHz Off dBm dB...

Page 136: ...itivity 11MHz 1GHz 2GHz 4GHz Table B 8 Test of FM demodulation sensitivity Item Test point frequency Test results FM demodulation sensitivity 11MHz 1GHz 2GHz 4GHz Table B 9 Test of third order interce...

Page 137: ...Hz 30dBm dB dB dBm 2GHz Off 1 99985G Hz 30dBm 2 00015G Hz 30dBm dB dB dBm 2 4GHz Off 2 39985G Hz 30dBm 2 40015G Hz 30dBm dB dB dBm 2 6GHz Off 2 59985G Hz 30dBm 2 60015G Hz 30dBm dB dB dBm 3GHz Off 2...

Page 138: ...Hz 10dBm dB dB dBm 3 5GHz On 3 49985G Hz 10dBm 3 50015G Hz 10dBm dB dB dBm 3 601 GHz 3 60085G Hz 30dBm 3 60115G Hz 30dBm dB dB dBm 4 1GHz 4 09985G Hz 30dBm 4 10015G Hz 30dBm dB dB dBm 4 6GHz 4 59985G...

Page 139: ...M Hz Off 219 85 MHz 30dB m 220 15 MHz 30dB m 300kH z dBm 440M Hz dBm dBm 500M Hz Off 499 85 MHz 30dB m 500 15 MHz 30dB m 300kH z dBm 1GHz dBm dBm 660M Hz Off 659 85 MHz 30dB m 660 15 MHz 30dB m 300kH...

Page 140: ...kH z dBm dBm dBm 6 8G Hz 6 79985 GHz 30dB m 6 80015 GHz 30dB m 300kH z dBm dBm dBm 6 95G Hz 6 94985 GHz 30dB m 6 95015 GHz 30dB m 300kH z dBm dBm dBm 7 5G Hz 7 49985 GHz 30dB m 7 50015 GHz 30dB m 300k...

Page 141: ...11 11GHz 10dBm dBm dBm dB 1GHz On 11 45GHz 10dBm dBm dBm dB 1 45GHz On 11 9GHz 10dBm dBm dBm dB 1 55GHz On 12GHz 10dBm dBm dBm dB 2GHz On 12 45GHz 10dBm dBm dBm dB 2 4GHz On 12 85GHz 10dBm dBm dBm dB...

Page 142: ...y interference output power Test results Mirror frequency Suppression 2 IF 30MHz Off 310MHz 25dBm dBm dBm dB 75MHz Off 355MHz 25dBm dBm dBm dB 90MHz Off 370MHz 25dBm dBm dBm dB 160MHz Off 440MHz 25dBm...

Page 143: ...0dBm dBm dBm dB 1GHz On 1 28GHz 10dBm dBm dBm dB 720MHz 10dBm dBm dBm dB 1 45GHz On 1 73GHz 10dBm dBm dBm dB 1 17GHz 10dBm dBm dBm dB 1 55GHz On 1 83GHz 10dBm dBm dBm dB 1 27GHz 10dBm dBm dBm dB 2GHz...

Page 144: ...dBm dBm dB 7 22GHz 25dBm dBm dBm dB 8GHz 8 28GHz 25dBm dBm dBm dB 7 72GHz 25dBm dBm dBm dB Table B 13 Test of IF suppression Item Center frequency Att Control IF frequency Signal generator setting po...

Page 145: ...dB 3 5GHz Off 5225MHz 25dBm dBm dBm dB 140MHz 25dBm dBm dBm dB 30MHz On 5225MHz 10dBm dBm dBm dB 140MHz 10dBm dBm dBm dB 75MHz On 5225MHz 10dBm dBm dBm dB 140MHz 10dBm dBm dBm dB 90MHz On 5225MHz 10d...

Page 146: ...m dBm dBm dB 140MHz 25dBm dBm dBm dB 4 75GHz 1975MHz 25dBm dBm dBm dB 140MHz 25dBm dBm dBm dB 5 2GHz 1975MHz 25dBm dBm dBm dB 140MHz 25dBm dBm dBm dB 5 7GHz 1975MHz 25dBm dBm dBm dB 140MHz 25dBm dBm d...

Page 147: ...ff 8 225GHz dBm 3 5GHz Off 8 725GHz dBm 3 601GHz 5 576GHz dBm 4 1GHz 6 075GHz dBm 4 6GHz 6 575GHz dBm 4 75GHz 6 725GHz dBm 5 2GHz 7 175GHz dBm 5 7GHz 7 675GHz dBm 5 85GHz 7 825GHz dBm 6 3GHz 8 275GHz...

Page 148: ...3GHz 15dBm dBm dBm dB 1 2GHz 15dBm dBm dBm dB 3 59GHz 15dBm dBm dBm dB 1 5GHz 15dBm dBm dBm dB 1 8GHz 15dBm dBm dBm dB 1 band low noise mode attenuator off 30MHz 25dBm dBm dBm dB 2 1GHz 25dBm dBm dBm...

Page 149: ...al spectrum analyzer Frequency range 250kHz to 13 2GHz Display average noise level 150dBm Hz FSW26 4051 4 Power meter Power range 70dBm 20dBm Calibration source magnitude 0dBm 2436 or E4419 5 Amplitud...

Page 150: ...amplitude information which are usually treated as a set Frequency scale The visible indicator cursor which can be placed anywhere on the screen trace provides a digital display of the absolute value...

Page 151: ...he interval between the LO frequencies of such multiple responses is two times of the IF Multiple responses occur only when the mixing mode overlaps and LO sweeps a sufficient range to make the input...

Page 152: ...t point unless otherwise specified The intercept point is usually expressed in dBm The larger the intercept point the better the linearity of the monitoring receiver which is a prerequisite for obtain...

Page 153: ...r example the cable TV is 75 The degree of mismatch between the rated impedance and the actual impedance is indicated by the voltage standing wave ratio VSWR Explicit average noise level In case of mi...

Page 154: ...stability which is caused by phase or frequency variations and is expressed as a bell like noise characteristic in the oscillator signal It affects the measurement ability of the whole machine to the...

Page 155: ...ndependent frequency scale to maximum peak CALCulate IFPan MARKer MMAXimum LEFT Set independent frequency scale to left adjacent peak CALCulate IFPan MARKer MMAXimum RIGHt Set independent frequency sc...

Page 156: ...the step value of IF panorama CALCulate IFPan STEP AUTO boolean CALCulate IFPan STEP AUTO Set or query the automatic switching status of the IF panoramic stepping value CALCulate PSCan AVERage TYPE a...

Page 157: ...or query the display window of the instrument DISPlay WINDow CATalog Query the list of display windows of the instrument FORMat BORDer output_order FORMat BORDer Set or query the endpoint order of th...

Page 158: ...SQUelch STATe Set or query the status of the squelch level switch OUTPut TONE CONTrol tone_level OUTPut TONE CONTrol Set or query monotone control OUTPut TONE GAIN tone_gain OUTPut TONE GAIN Set or qu...

Page 159: ...termination frequency SENSe FREQuency CW FIXed receive_frequency SENSe FREQuency CW FIXed Set or query the reception frequency of fixed frequency reception mode SENSe FREQuency CW FIXed STEP INCReme...

Page 160: ...SWEep DWELl Set or query frequency scan dwell time SENSe SWEep HOLD TIME hold_time SENSe SWEep HOLD TIME Set or query the hold time of the frequency scan SENSe SWEep STEP step_width SENSe SWEep STEP...

Page 161: ...SYSTem ERRor CODE ALL Query all error codes in the error queue and zero out the error list SYSTem ERRor CODE NEXT Query the first error code in the error queue and clear the error from the error list...

Page 162: ...Cord SOURce data_source TRACe DATA RECord SOURce Set or query the data source of the record TRACe DATA RECord STARt TRACe DATA RECord STARt Set or query record start switch status TRACe DATA RECord ST...

Page 163: ...n Set or query the trigger location TRIGger SEQuence SOURce trig_source TRIGger SEQuence SOURce Set or query the trigger source TRIGger SEQuence STARt SLOPe trig_slope TRIGger SEQuence STARt SLOPe Set...

Page 164: ...13 SAVEFILE ERR Saving file failed 14 LICENSE ERR Invalid License 15 LICENSE OPEN Opening License failed 16 NO MEMRY Dynamic memory allocation failed 17 SPACE LOW Insufficient disk space 18 CRET DIRY...

Page 165: ...ator of A2 board 123 A3 LO1 Temp Temperature abnormality near 1st local oscillator of A3 board 200 CMD ERR Command with parameter not allowed 201 CMD ERR Command parameter error 202 GPIB ERR Current m...

Page 166: ...in number 123 Exponent too large 124 Too many digits 128 Numeric data not allowed 130 Suffix error 131 Invalid suffix 134 Suffix too long 138 Suffix not allowed 140 Character data error 141 Invalid c...

Page 167: ...re missing 250 Mass storage error 257 File name error 258 Media Protected 291 Out of memory 292 Referenced name does not exist 293 Referenced name already exists 300 Device specific error 350 Queue ov...

Reviews: