background image

Chapter VII Performance feature test 

119 


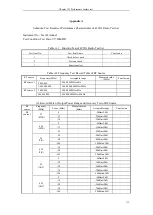
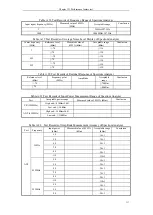
Table A.26 Test Records of SINAD Measurement Accuracy of Audio Meter 

ZN5541 setting 

Measured value of 

VA-2230A (dB) 

Measured value of 

4992A (dB) 

Difference 

  (dB) 

Acceptable 

range 

  (dB) 

Conclusion 

40% (about 8dB) 


1.5 


10% (about 20dB) 


1% (about 40dB) 


Table A.27 Test Records of Measurement Accuracy of Digital Voltmeter 

Measurement 

mode 

Setting of output 

signal 

Measured value of 

4992A 

Error 

Acceptable range 

Conclusion 

AC (1kHz) 

100mVp 


10% 


1Vp 


10% 


3Vp 


10% 


DC 

100mV 


10% 


1V 


10% 


3V 


10% 


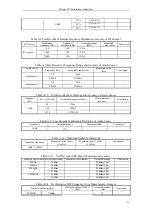
Table A.28 Test Records of Vertical Measurement Accuracy of Oscilloscope 

Input 

selection 

Channel selection 

Input signal 

amplitude 

Measured value 

of 4992A 

Acceptable 

range 

Conclusion 

Audioinput 

  (1kHz) 

0.1V~3V 

0.2 V

p-p


0.2

0.02 V

p-p


2 V

p-p


2

0.2 V

p-p


5 V

p-p


5

0.5 V

p-p


DVM input 

AC 

(1kHz) 

0.1V~3V 

0.2 V

p-p


0.2

0.02 V

p-p


2 V

p-p


2

0.2 V

p-p


5 V

p-p


5

0.5 V

p-p


DC 

0.1V~3V 

0.1V 


0.1

0.01V 


1V 


1

0.1V 


3V 


3

0.3V 


Table A.29    Test Records of Horizontal Measurement Accuracy of Oscilloscope 

Width of tested pulse signal 

ms() 

Measured value of 4992A 

(ms) 

Error 

Acceptable range 

Conclusion 

200 


3% 


Table A.30    Cable Test Records 

Measurement Item 

Measured value of 4992A 

Acceptable range 

Conclusion 

SWR measurement accuracy 

(130MHz) 


1.22~1.49 


SWR measurement accuracy 

(300MHz) 


1.77~2.15 


SWR measurement accuracy 

(500MHz) 


2.50~3.04 


SWR measurement accuracy 

(700MHz) 


2.80~4.20 


SWR measurement accuracy 

(1000MHz) 


3.18~4.75 


DTF measurement accuracy 


4m

10% 


Summary of Contents for 4992A

Page 1: ...I 4992A Radio Test Set User Manual China Electronics Technology Instruments Co Ltd...

Page 2: ......

Page 3: ...er II describes how to handle a new Radio Test Set as well as the precautions during operation Chapter III mainly introduces the front panel external interfaces etc Chapter IV introduces the basic ope...

Page 4: ...the limitations in the author s knowledge there may be errors or omissions in this manual Your comments are highly appreciated We apologize for any inconvenience that may rise therefrom Editor Januar...

Page 5: ......

Page 6: ......

Page 7: ......

Page 8: ...an effective thermal conductor to transmit heat from the casing 2 Safety precautions for other instrument equipment 1 Check the working condition and turn off RF output before connecting the instrume...

Page 9: ...Ltd The scraped instrument must not be discarded or disposed without permission Please inform t China Electronics Technology Instruments Co Ltd or a qualified professional recycling organization for r...

Page 10: ...N GUIDE 12 Section 1 Unpacking Inspection 12 1 Model confirmation 12 2 Appearance inspection 12 Section 2 Safety Instructions 12 1 Environmental requirements 12 2 Selection of power line 13 3 Power su...

Page 11: ...smitter Function 27 Section 2 Operation Guidance for RF Receiver Function 31 Section 3 Operation Guidance for Cable Test Function 39 Section 4 Operation Guidance for Call Function 46 Section 5 Operati...

Page 12: ...trument WARNING WARNING denotes a hazard It calls attention to a procedure which if not correctly performed or not adhered to could result in injury or loss of life CAUTION CAUTION calls out user s sp...

Page 13: ...It is not only suitable for production and commissioning of simple laboratory application and communication device but also applicable to field on site installation maintenance support service etc It...

Page 14: ...nal simulation function Two way audio signal generation and audio signal frequency level distortion and SINAD analysis function RF high power measurement and signal strength indication function RF fre...

Page 15: ...o Test Set with integration of various instruments is suitable for full performance tests of various on board commercial radios wireless intercoms etc The test process will be simplified the costs wil...

Page 16: ...7GHz 5dBm 100dBm ANT Source 1 2MHz 1 8GHz 15dBm 100dBm ANT Source 1 1 8GHz 2 7GHz 50dBm 120dBm T R Source 1 2MHz 2 2GHz 55dBm 125dBm T R Source 1 2 2GHz 2 7GHz 5dBm 100dBm ANT Source 2 Power resoluti...

Page 17: ...ponding to positive voltage Audioinput Load 150 600 1k High Z Input level 0 05Vp to 3Vp Frequency range 300Hz 5kHz Tuning sensitivity 1kHz 35mVrms Slope positive frequency deviation corresponding to p...

Page 18: ...ceiver reference level 70dBm 100dBm 10dBm 1GHz 2 7GHz Resolution 0 01dBm Accuracy 3dB 4 Demodulation meter RF input port ANT port and T R port Frequency range 2MHz 1000MHz 1 GHz option default 2MHz 27...

Page 19: ...dth 10kHz reference level of receiver 70dBm 130dBm bandwidth 10kHz reference level of receiver 70dBm 2 7 GHz option 110dBm bandwidth 10kHz reference level of receiver 70dBm 2MHz 2GHz 130dBm bandwidth...

Page 20: ...t effective value position peak value and average value Display unit V and mV Display resolution 1 0 1 0 01 and 0 001 Accuracy 10 1 gear 8 Oscilloscope optional Audioinput Frequency range 20Hz 20kHz L...

Page 21: ...able test Frequency range 2MHz 1000MHz Frequency resolution 0 1MHz Cursor 3 Test type standing wave ratio SWR return loss RL cable loss LOSS and distance to fault DTF VSWR measurement accuracy using 2...

Page 22: ...ame Identification Interface type RF input output port ANT BNC interface T R BNC interface RF output port SWR BNC interface Audio output port Audio Out BNC interface Audio DVM input port Audio In DVM...

Page 23: ...Article I Handling Instructions 11 Article I Handling Instructions...

Page 24: ...hnology Instruments Co Ltd we ll tackle problems as soon as possible CAUTION The instrument is a kind of valuable device and should be handled with care 2 Appearance inspection Carefully check whether...

Page 25: ...ply requirements 4992A can be powered up in three methods AC power supply and power supply with adapter If the AC power supply is applied use the accompanying AC DC adapter The input of the adapter sh...

Page 26: ...N The rechargeable battery must not be exposed to fire or high temperature environments above 70 or placed in fresh water or salt water or made wet It must be kept away from children The rechargeable...

Page 27: ...pedance must be applied in strict accordance with the port requirements to prevent the circuits at subsequent levels from damage 6 Cleaning of display of front panel If required after operation of cer...

Page 28: ...allation and Replacement 3 Battery status check 4992A Radio Test Set is provided with one battery The user can check the battery status in one of the following methods Observe the battery icon on the...

Page 29: ...of the system status bar of the touch screen will be full In addition the run out battery should be charged for about 4h in the shutdown status 5 Battery life The battery charge and discharge are limi...

Page 30: ...isplay backlight will be ON About 30 seconds is required to wait for display start up Then the normal start status interface will appear There should be no warning prompt on the display interface afte...

Page 31: ...Chapter II Operation Guide 19 Impedance high impedance 7 Requirement of test results RF frequency error 0 2Hz Audio frequency 1kHz 0 1Hz...

Page 32: ...menu setting and greatly simplifying the operation The display zone can display the following information corresponding to various functions of the instrument multiple instrument windows that include...

Page 33: ...re displayed in this zone Window management zone Multiple meters are integrated in this instrument In order to reasonably utilize the display zone at most four meter window can be displayed at the sam...

Page 34: ...ion and message record are displayed File is applied to save or call the setting status of the instrument Window is applied to switch the current active meter window Menu is applied to change into the...

Page 35: ...el description 23 power switch for more than 3 seconds to turn off the Radio Test Set Note Flicker of the indicator indicates that the electricity quantity of the battery is not full at present and th...

Page 36: ...1 or test the standing wave ratio insertion loss return loss and other indicators of the cable by comparison of output and reflected signals so as to determine the distance to fault of the cable 4 Aud...

Page 37: ...t data and files in the instrument 10 LANinterface This instrument is equipped with one 10 100Mbps LAN interface of standard 8 pin structure Two data rates can be selected automatically This interface...

Page 38: ...s of 4992A Radio Test Set The operation process of this instrument is introduced in details below according to the functions CAUTION If Reset on the front panel is pressed the instrument will be run a...

Page 39: ...window as the current active window and the corresponding menu will pop up on the right of the window as shown in Fig 4 1 Set the output port of Source 1 click Port in the window and select the outpu...

Page 40: ...requirements of RF Source 1 Note that the modulation wave must be loaded by RF Source 1 Set the modulation source click Modulation Source in the window and select the type of the modulation source or...

Page 41: ...indow and the corresponding menu will pop up in the right side of the window as shown in Fig 4 3 Set the output port of Source 2 only the ANT port is for output of RF Source 2 If RF Source 2 is ON ANT...

Page 42: ...tation the influence on the output channel of the RF source cannot be completely eliminated and the above signal is the main source of stray signal of the instrument In addition to the influence on So...

Page 43: ...screen and select the output unit dBm W V and dB V Average setting the real time broadband power is measured in RF power measurement Therefore the averaging of measurement results can be set according...

Page 44: ...or measuring the frequency error between the input signal and the set frequency point This is designed for the RF ANT and T R port The user can select the appropriate port to input the tested signal a...

Page 45: ...capture range select the minimum IF bandwidth to obtain more accurate measurement results Automatic search setting 4992A has the function of automatic search The input signal of the port can be search...

Page 46: ...ort frequency reference level IF bandwidth automatic search etc The setting method and procedures are the same as those of RF frequency error measurement and thus not repeated here Display of measurem...

Page 47: ...n the receiver setting window that is opened at the same time Select the demodulation meter and press the Full Screen hard key in the lower part of the screen to maximize the window as shown in Fig 4...

Page 48: ...ion and THD N total distortion The user can select the type according to the requirements Alarm setting judge whether the measurement result conforms to the requirements If it is beyond the range the...

Page 49: ...filter click the Audio Filter in the right Receiver Setting menu The low pass high pass or band pass filter can be selected according to the modulation rate Optional filter types are as follows 0 3 20...

Page 50: ...te the frequency of the input signal click the Center Frequency soft key in the right menu and set the center frequency Setting of frequency step in order to change the center frequency more easily cl...

Page 51: ...ge The averaging of measurement results can be set according to the stability requirements When Average is ON the measurement result will be displayed after averaging according to the set times Sectio...

Page 52: ...tested cable to the test instrument and then connect the matching load to the cable end The measured return loss curve will be displayed on the test instrument as shown in Fig 4 14 Fig 4 14 Return Los...

Page 53: ...of each frequency point of the tested device within the whole frequency band The sweep width can be set according to the working frequency of the tested cable or tested device in the test 2 Cable los...

Page 54: ...alue of the vertical axis The display setting of the vertical axis can be adjusted automatically by clicking Automatic Setting Display mode click the Display Mode soft key in the right menu and select...

Page 55: ...ency and stop frequency Setting of test type click the Test Type soft key in the right menu and select the test type DTF fault point positioning measurement DTF test setting Setting of cable type clic...

Page 56: ...Display of measurement results Display setting click the Display Setting soft key in the right menu to enter the menu of next level and set the top value and bottom value of the vertical axis The disp...

Page 57: ...ter frequency setting the current maximum test distance can be determined shown in the lower right corner of the display zone of the instrument The user can properly reduce this distance according the...

Page 58: ...mitted as the output and if the PTT switch is released the received signal will be demodulated and transmitted to the audio box speaker as the output Window opening four windows i e RF source modulati...

Page 59: ...ne audio source for output Window opening open and select the audio source window by pressing the Audio hard key or pressing the Measurement hard key and setting the instrument menu and maximize this...

Page 60: ...e noise source can be changed in the same method Setting of output port as shown in Fig 4 28 select the audio or noise signal transmission to the audio output port and audio box speaker by clicking th...

Page 61: ...key and setting the instrument menu and press the Full Screen hard key in the lower part of the screen to maximize this window as shown below Fig 4 29 Audio Meter Display Window Menu calling click the...

Page 62: ...quirements Alarm setting judge whether the measurement result conforms to the requirements If it is beyond the range the alarm color will be displayed to make the judgment more intuitive Click Alarm S...

Page 63: ...bility requirements If he avera is ON the measurement result will be displayed after averaging according to the set times CAUTION One port is shared for external audio input and digital voltmeter sign...

Page 64: ...emodulation type audio filter etc according to the level characteristics of the demodulated signal Then connect the signal to the corresponding to the RF input port and observe the measurement result...

Page 65: ...the Trigger soft key in the right men of the touch screen for port setting The window shown in Fig 4 39 will pop up Fig 4 39 Oscilloscope Trigger Setting Window Click Pulse Edge in the right menu of t...

Page 66: ...ting internal sampling rate setting and tested signal frequency is as follows Time setting ms div Actual sampling rate kHz Frequency band Hz 0 2 250 10kHz 20kHz 0 5 100 5kHz 10kHz 1 50 2 5kHz 5kHz 2 2...

Page 67: ...Guidance 55 CAUTION The oscilloscope window is applied for auxiliary monitoring and display of low frequency signals It is separately used in general except that the RF source and audio source are ena...

Page 68: ...RF meter audio meter oscilloscope demodulation meter digital voltmeter and spectrum analyzer as shown below Fig 5 1 Measurement Window 1 1RF source Press the Measurement hard key select the RF source...

Page 69: ...ut port including SWR ANT and T R If RF Source 2 is ON only the ANT port can be selected RF source OFF ON Open or close the corresponding RF source RF Source 1 or 2 The RF source can be selected in th...

Page 70: ...pop up including Carrier Modulation Source Internal Audio Setting External Audio Impedance Amplitude Modulation AM OFF ON and FrequencyModulation FM OFF ON They can be selected and set in the window...

Page 71: ...ulation source The values can be adjusted with the number keys step keys or knob External audio impedance The external audio impedance can be set only when the modulation source is the external audio...

Page 72: ...wer testing function Compensation frequency of frequency response Set the compensation frequency of frequency response of RF power measurement The default value is 1GHz Signal intensity unit Select th...

Page 73: ...MHz Filter 3kLP Level 0 dBm IFBW 600kHz FreqStep 1kHz Search Off On IFBW1 2 5kHz 6 25kHz 8 33kHz Return 10kHz 12 5kHz 25kHz Next IFBW2 2 30kHz 60kHz 100kHz Return 300kHz 600kHz Filter1 2 0 3 20kBP 0 3...

Page 74: ...adjusted with the number keys step keys or knob Automatic search Enable or disable the function of automatic search 1 3Demodulation meter Press the Measurement hard key select the demodulation meter...

Page 75: ...d value is smaller than the lower alarm limit the background will become blue 1 3 1 Receiver Setting When the demodulation meter window is opened the receiver setting window will pop up at the same ti...

Page 76: ...or knob Audio source 2 Include the ON OFF state frequency and amplitude setting of Audio Source 2 The frequency or amplitude can be adjusted with the number keys step keys or knob Noise Source Include...

Page 77: ...e OFF ON Enable or disable the function of continuously averaging the frequency values average frequency Set up average frequency Distortion type Select the distortion type THD or THD N The default ty...

Page 78: ...en and select the digital voltmeter window The Digital Voltmeter menu will pop up including Measurement Mode Range Selection Unit Resolution Average OFF ON Averaging Times and Zero Calibration The men...

Page 79: ...quency Set up average frequency Zero correction Calibration the zero position of the audio meter 1 7 Cable Tester Press the Measurement hard key select the cable tester in the screen click OK and open...

Page 80: ...to Cable User Velocity 1 DTFTest Return Loss 0 dB m EstLength 24 048 m Open Short Calibration Return Load Start Done Center 501 MHz Span 998 MHz FreqSet Return Start 2 MHz Stop 1 GHz Peak LeftPeak Rig...

Page 81: ...tic Setting If Automatic Setting is selected the top value and bottom value of the vertical axis will be set automatically according to the actual range so as to achieve the best display effects Displ...

Page 82: ...pen circuit device and select the open circuit as the calibration standard Calibration Short circuit Connect the short circuit device and select the short circuit as the calibration standard Calibrati...

Page 83: ...0 01 3V Zero Impedance 150 600 1k Return HighZ Range 1 30V 0 01 3V Return Auto DVMSet Coupling AC Zero Range 0 01 3V Zero Coupling DC GND AC Range 2 60V 0 1 3V Return Auto C Return Fig 5 11 Oscillosc...

Page 84: ...r Pulse Edge Rising Falling Select the trigger pulse edge as the rising edge or falling edge Trigger Trigger level Set the trigger level and determine the vertical height of the trigger point Trigger...

Page 85: ...pop up The impedance and range can be set Zero calibration can be done to the oscilloscope Refer to Section 1 5 of this chapter for setting of Impedance and Range Such setting requirements are not rep...

Page 86: ...RMS Return Fig 5 12 Spectrum Analyzer Menu Center Freq Enable the center frequency The center frequency can be adjusted with the number keys step keys or knob The step keys and knob change according...

Page 87: ...he current cursor The frequency information can be read with the cursor and the values are displayed in the cursor display area in the upper part of the screen The selected cursor has the following fu...

Page 88: ...frequency and amplitude of this cursor are displayed in the upper right corner of the screen The current active functions are not affected by this key Cursor Left peak Search next peak on the left sid...

Page 89: ...tion Meter and Audio Source For specific settings of corresponding menus refer to Section 1 2 1 2 1 1 3 and 1 4 of this chapter 3 Receipt Receiver The window related to RF receiver testing will pop up...

Page 90: ...nt such as the frequency setting When this key is pressed the file name dialog box will pop up In this case you can enter the file name with the number keys and press OK to complete the status saving...

Page 91: ...Message record Display the prompt or error information records You can exit the display interface with the OK or Cancel key Date setting Set the date and time of this instrument After the date setting...

Page 92: ...ay the internal temperature of the instrument LO frequency calibration The LO frequency calibration window will pop up Device ID Display the serial number of the instrument Option activation The input...

Page 93: ...81 Article II Technical Specifications...

Page 94: ...gram of system functions of the Radio Test Set are shown in Fig 6 1 System hardware can be divided into the RF module low frequency and digital processing module multi function component display touch...

Page 95: ...s of integrated test formed by the RF module digital signal processing platform and microprocessor The following functions can be realized real time RF frequency error measurement IF modulation demodu...

Page 96: ...wer output 120dBm to 20dBm E4438C 2 Solid state amplifier Frequency range 800MHz 3000MHz Small signal open loop gain 50dB Saturated output power 48dBm 38701E 3 Function generator Agilent 33250A 4 Stan...

Page 97: ...ent Frequency meter recommended model Agilent 5350B One N BNCadapter One RF cable 80cm c Test steps 1 Connect the test instrument as shown in the figure and warm it up for 30min 2 Open the RF source w...

Page 98: ...source window by pressing the Receiver hard key or pressing the Measurement hard key and setting the instrument menu Set it as follows Output port SWR RF Source 1 ON The modulation window must not be...

Page 99: ...y pressing the Receiver hard key or pressing the Measurement hard key and setting the instrument menu Set RF Source 1 as follows Port ANT Frequency 1000MHz Power 5 dBm RF Source 1 ON 3 Set the spectru...

Page 100: ...Hz to 400MHz 6 According to the output frequency of RF Source 2 properly adjust the center frequency of the spectrum analyzer measure the parasitic harmonics by the standard frequency and standard fre...

Page 101: ...sitic harmonics by the standard frequency and standard frequency difference function observe and find the point with the poorest non harmonics and record the test result into Table A 6 6 Accuracy of i...

Page 102: ...it and warm it up for 30min 2 Connect the power sensor of the measuring receiver to the RF output port ANT of the instrument 3 Open the RF source window by pressing the Receiver hard key or pressing...

Page 103: ...the measurement speed SP as slow 4 Set the frequency of Audio Source 1 according to Table A 9 and record the measurement results 5 Close Audio Source 1 of the test instrument open the output of Audio...

Page 104: ...ps 1 Connect the device as shown in the figure start it and warm it up for 30min 2 Open the audio source window by pressing the Audio hard key or pressing the Measurement hard key and setting the inst...

Page 105: ...rrect and record it in Table A 12 12 Accuracy of RF power measurement a Test items The ordinary signal source and power amplifier are applied in the following steps to generate high power test signals...

Page 106: ...the table correspondingly change the frequency of the tested device read the RF power test result and record it in Table A 13 6 Test the 43dBm high power signal At first calibrate the attenuation of t...

Page 107: ...n frequency of frequency response 1000MHz Enable the output of the signal source read the RF power test result and record it in Table A 13 13 Accuracy of RF frequency error measurement a Test items Th...

Page 108: ...14 Record the RF frequency error reading in Table A 14 5 Set the output of the RF source as follows Frequency of RF Source 1 500 2MHz RF Source 1Power 10dBm 6 Keep the frequency setting of RF meter an...

Page 109: ...ecord the reading of the received signal strength in Table A 15 5 Set the frequency and power output of the signal source in Table A 15 Correspondingly change the receiver setting port frequency and r...

Page 110: ...ion is used as the benchmark to test the accuracy of frequency modulation deviation measurement of the tested device The accuracy of frequency modulation deviation measurement of this instrument is 5...

Page 111: ...g the Transmitter hard key or pressing the Measurement hard key and setting the instrument menu Set it as follows Port SWR Frequency of RF Source 1 2MHz RF Source 1Power 10dBm RF Source 1 ON The modul...

Page 112: ...ON Averaging times 16 3 Set the cursor as the maximum value Read the level value L of the cursor record the test result in the test result table A 18 and disable the averaging function 4 Change the r...

Page 113: ...ponse point with the cursor and record measurement results If the amplitude of the residual response signal is small the resolution bandwidth should be further reduced to decrease the displayed averag...

Page 114: ...fier through the cable Then connect the amplifier output to the sensor of the power meter through the attenuator group 4 Open the output of the signal source adjust its output power and observe the me...

Page 115: ...the ANT port of the tested device Set the output of the signal source as follows Frequency 499MHz Power 25 dBm 10 Open the spectrum analyzer window by pressing the Measurement hard key and setting the...

Page 116: ...5 Change the output frequency and power of the signal source according to Table A 22 Set the center frequency and reference level of the tested spectrum analyzer according to the input signal and rec...

Page 117: ...erator analyzer is applied as the benchmark to check the audio frequency measurement accuracy of the tested device The audio frequency range of this instrument is 15Hz to 20kHz and the frequency accur...

Page 118: ...d the audio voltage readings in Table A 24 20 Distortion measurement accuracy of audio meter a Test items The ZN5541 audio distortion source is applied to generate audio distortion signals and VA 2230...

Page 119: ...egree of ZN5541 audio distortion source according to the requirements of Table A 25 and record the distortion test results of the tested device in Table A 25 21 SINAD measurement accuracy of audio met...

Page 120: ...d device in Table A 26 22 Measurement accuracy of digital voltmeter a Test items The output signal of the function generator is used as the benchmark to test the accuracy of Vrms Vpeak and Vavg measur...

Page 121: ...the digital voltmeter in Table A 27 23 Oscilloscope tested if any A Vertical measurement accuracy a Test items The external audio DVM signal and internal demodulation signal can be tested with the osc...

Page 122: ...llows Port setting DVM DVM setting coupling mode AC Range 0 1V to 3V 6 Repeat Step 4 and record the results in the test record table A 28 7 Then test the measurement accuracy of the DC input signal of...

Page 123: ...tanding wave ratio VSWR a Test items The standing wave ratio of the tested instrument is measured in the open circuit and matching status of the port after calibration The indicator requirements are a...

Page 124: ...strument equipment N type calibration kit recommended model 31101 Standard test cable 4m c Test steps 1 Turn on the instrument for 30min warm up 2 Open the cable test window of the tested device by pr...

Page 125: ...clusion RF source 1 2 000 000 2 000 000MHz 4Hz 1 000 000 000 1 000 000 000MHz 2kHz RF source 2 2 000 000 2 000 000MHz 4Hz 400 000 000 400 000 000MHz 800Hz A 3 Record Table of Output Power Range and Ac...

Page 126: ...on RF source 1 1 000 20 95 RF source 2 400 20 95 Table A 5 Test Records of Parasitic Harmonics of RF Source RF source Carrier frequency MHz Port Acceptable range dBc Measured value Conclusion Frequenc...

Page 127: ...requency Hz Level mVrms Acceptable range mVrms Measured value mVrms Conclusion 1 000 20 20 4 100 100 12 1 570 1 570 159 Table A 11 Test Records of Harmonic Distortion of Audio Source Frequency Accepta...

Page 128: ...ANT 2 10 3 70 110 499 10 3 70 110 999 10 3 70 110 T R 2 20 3 0 50 499 20 3 0 50 999 20 3 0 50 Table A 16 Records of Am Demodulation Measurement Accuracy Modulation depth of synthetic source Acceptabl...

Page 129: ...idual Response of Spectrum Analyzer Reference level dBm Frequency point MHz Amplitude Acceptable range Conclusion 70 70dBm 70 80dBm Table A 21 Test Records of Input Power Measurement Range of Spectrum...

Page 130: ...ested audio signal Hz Measured value of 4992A Hz Acceptable range Hz Conclusion 20 20 2 1 000 1 000 2 20 000 20 000 2 Table A 24 Test Records of Voltage Measurement Accuracy of Audio Meter Range Audio...

Page 131: ...Input signal amplitude Measured value of 4992A Acceptable range Conclusion Audioinput 1kHz 0 1V 3V 0 2 Vp p 0 2 0 02 Vp p 2 Vp p 2 0 2 Vp p 5 Vp p 5 0 5 Vp p DVM input AC 1kHz 0 1V 3V 0 2 Vp p 0 2 0 0...

Page 132: ...Article III Maintenance Instructions 120 Article III Maintenance Instructions...

Page 133: ...accurate as possible so that we can solve this problem as soon as possible If any problem occurs to 4992A you can check the instrument according to the following prompts If the problem exists contact...
Page 134: ...instrument has to be returned for repair pack it according to the following steps 1 Prepare one copy of paper file describing the instrument failure and place it into the packing box together with th...

Reviews: