- 73 -
8-17. Auto Range Settings
“A.Range”
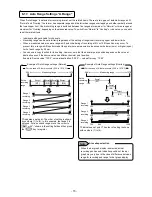
When “Auto Range” is selected for recording format, set the related items. There are two types of automatic range-shift:
“Normal” and “Overlap”, the former has separate ranges and the latter has ranges overlapping each other partially around
the lower/upper limit. Chart recording range is switched
between five ranges at maximum for “Normal” or three ranges at
maximum for “Overlap” depending on the measured value. To switch from “Normal” to “Overlap” or vice versa, you need to
reset the related items.
• Individual setting available for channels.
• Recording range can be set arbitrarily regardless of the setting of range/chart recording upper and lower limits.
• When a measured value is near a range-shift point, chattering of recording at 0% or 100% position may occur. To
prevent this, a range-shift is performed at the point where a measured value exceeds the lower (zero) or higher (span)
limit of each range by 0.5mm.
• You can use a copy function for the setting. However, note that the decimal point position depends on the value at
destination even if the source value has different decimal point position.
Example: Source v
alue “120.3”, value at destination “20.05” → value after copy “12.03”
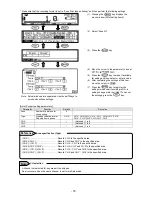
▼ indicates a set point. The order of setting is shown
by numbers (1) to (5). In this example, the range 5 is
not used. For an unused range, move the cursor to
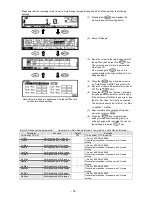
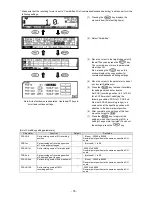
Set with
“-“ shown in the setting field and then press
the
key to register.
-200
1370
Entire
recording
range
(R1)
Range 1
Range 2 Range 3
Range 4
-100
400
600
800
1200
(R2)
(R3)
(R4)
Measuring range
(1)
(2)
-100
400
400
600
600
800
800
1200
Range 1
recording
Range 2
recording
Range 3
recording
Range 4
recording
(3)
(4)
(5)
Example of Auto Range settings (Normal)
For the case of K thermocouple (-200 to 1370°C)
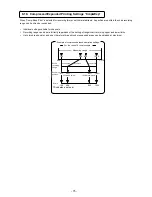
▼ indicates a set point. The order of setting is shown
with numbers (1) to (6).
Example of Auto Range settings (Overlap)
-200
1370
Entire
recording
range
(R1)
Range 1
-100
600
Measuring range
Range 2
500
800
(R2)
Range 3
700
1200
(R3)
(1)
-100
600
Range 1
recording
500
800
Range 2
recording
1200
Range 3
recording
700
700
800
(2)
(3)
(4)
(5)
(6)
For the case of K thermocouple (-200 to 1370°C)
When the bar graph display is selected, actual
recording position and indication position of the bar
graph may vary due to the case of difference between
range for recording and range for bar graph display.
At overlap selection
Note


